Highest outside of bands indicator help


Hi there,

I have this indicator:


The red line, and the other lines, as you can see stops 2 bars away from where the new line starts.

I want the line to go in to the bar that breaks above it. 

I've played around to try and get the line to go in to the bar that breaks above it, before the new line begins.

I think this is something to do "LT_Hv[i+1]=LTHighLevel;" but fiddling with that e.g i, i-1, i-2 etc, doesn't effect the chart as desired.

My code is below and shows only code that applies to the red line, to simplify your assistance process.

int i;

int      HigherTF=PERIOD_D1;

int      LTHighLevel_Index;
int      LastLTHighLevel_Index;

double   LTHighLevel;
double   LT_Hv[];

bool     NewLTHigh;
int      NewLTHighStartBar;

string   text;

double   UpperLine;
double   LowerLine;
//+------------------------------------------------------------------+
//| Custom indicator initialization function                         |
//+------------------------------------------------------------------+
int OnInit()
  {

//--- indicator buffers mapping
   SetIndexStyle(2,DRAW_LINE,STYLE_SOLID,1,Red);
   SetIndexDrawBegin(2,i);
   SetIndexBuffer(2,LT_Hv);
   SetIndexLabel(2,"LTResistance");
//---
   return(INIT_SUCCEEDED);
  }
//+------------------------------------------------------------------+
//| Custom indicator iteration function                              |
//+------------------------------------------------------------------+
int OnCalculate(const int rates_total,
                const int prev_calculated,
                const datetime &time[],
                const double &open[],
                const double &high[],
                const double &low[],
                const double &close[],
                const long &tick_volume[],
                const long &volume[],
                const int &spread[])
  {
//---

   i=Bars;

   while(i>=0)
     {
      UpperLine=NormalizeDouble(iCustom(NULL,HigherTF,"AG Keltner Channel",0,i),8);

      LowerLine=NormalizeDouble(iCustom(NULL,HigherTF,"AG Keltner Channel",2,i),8);
    
      //Find new LT highs
      if(NewLTHigh==false)
        {
         if(iHigh(Symbol(),HigherTF,i)>UpperLine && 
            iHigh(Symbol(),HigherTF,i)>LTHighLevel)
           {
            NewLTHighStartBar=i;
            NewLTHigh=true;
           }
           
         if(NewLTHighStartBar-i>0) LT_Hv[i+1]=LTHighLevel;
        }

      if(NewLTHigh==true)
        {
         if(i<NewLTHighStartBar)
           {
            LTHighLevel_Index=iHighest(Symbol(),HigherTF,MODE_HIGH,NewLTHighStartBar-i,i+1);

            if(NewLTHighStartBar-i>0)
              {
               LTHighLevel=iHigh(Symbol(),HigherTF,LTHighLevel_Index);

               LT_Hv[i+1]=LTHighLevel;

               LastLTHighLevel_Index=i;
              }
           }
        }

      if(iHigh(Symbol(),HigherTF,i)<UpperLine)
        {
         NewLTHigh=false;
        }

      Comment(text);

      i--;
     }
//--- return value of prev_calculated for next call
   return(rates_total);
  }


Can you please advise how to get the line to draw  a couple bars extra, so that price breaks above it, before drawing the new line?

Kind thanks and regards.


Th 'line-break' (=the hole at the last bar) is probably intended because it prevents the connection between the previous level and the next level.

Otherwise it would look like these pivot lines:


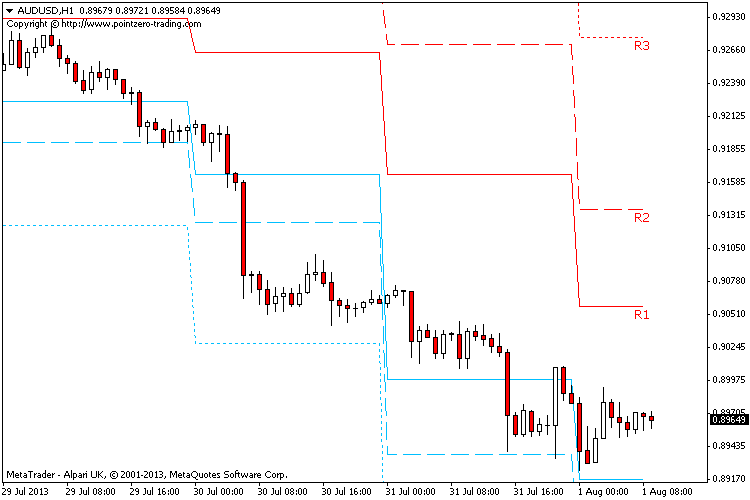
In my screen shot above the first red line shows a resistance level that price breaks above and then returns below.

My EA will view this as a falsebreakout, so I want this level to remain intact until the falsebreakout condition expires.

I think I might need to have PrevLTHighLevel and NewLTHighLevel buffers.

Will explore this.

Thanks. 

Reason: