Week High-Low from lower timeframe
Just in case anyone wonders why I'm doing this indicator it is because I've read that at the end of the day, end of the week, end of the month and end of quarter traders tend to close more positions. They are supposed to close first the winning ones and that creates a counter trend movement and at the very last moments they close the losing ones, and that creates a movement that resumes the trend.
I just wanted to ckeck that :)
Hi there, I've been fighting this thing since yesterday, tried different things, googled like a mad... I can't make it work. Let me explain:
I want an indicator that marks with a vertical line the end of different times (end of day, end of week, end of month, end of quarter). The length of the vertical line goes from High to Low of the specific period, that way I can compare the end of the period with the overall range of the period:
- End of Day (5pm NY, only visible when TF is < PERIOD_D1). The line goes from High to Low of that day. WORKS.
- End of Week (Friday 5pm. Length of vertical line is from High to Low of that week. TF < PERIOD_W1). NOT WORKING
- Month and quarter not implemented yet, I'm stack in the week one.
Honestly, I don't know why the End of Week doesn't work, the logic should be quite similar than the End of Day. This is my Start() method. Below I'll copy the whole indicator code:
...
What do you mean by "doesn't work" ?
I mean that I don't see a line that goes from the highest of the week to the lowest of the week at 5pm on Friday. There is no line at all. I can put:
      if(IsFriday(t) && IsEndOfDay(t) && DisplayEndOfWeek())
      {
         l2UpBuffer[i] = High[i] + 0.01;
         l2DnBuffer[i] = Low[i] - 0.01;
      }
and it draws a vertical line from the H1 candle, 100 pips up from the high of i and 100 pips down from the low of i. But if I try to get the highest and lowest of the week nothing comes to the chart.
I mean that I don't see a line that goes from the highest of the week to the lowest of the week at 5pm on Friday. There is no line at all. I can put:
and it draws a vertical line from the H1 candle, 100 pips up from the high of i and 100 pips down from the low of i. But if I try to get the highest and lowest of the week nothing comes to the chart.
Here is what I get. Seems to "work". My chart is GMT+2.
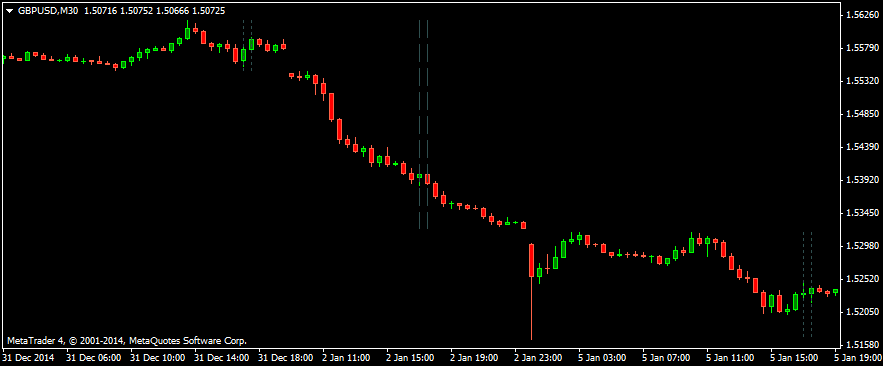
Ummm strange, it didn't work for me like it does for you. Ok, I think this proves that the code works and it might be a problem of my MT4 installation. Weird thing of the double bars in your screenshot, my end of day mark doesn't come doble.
Thanks for your time angevoyageur. I think it is an interesting piece of information to check for price movements as we get close to the end of a certain period.
hi man
Try something like that, put different color for the buffers :
void start()
{
   int limit=-1,  counted_bars = IndicatorCounted();
   if(counted_bars < 100)  limit = Bars -1000 ;
   if(counted_bars > 0) counted_bars--;
    limit = Bars-counted_bars;

   for(int i = limit ;i >= 0 ;i--)
   {
      if(TimeDayOfWeek(iTime(Symbol(), Period(), i) )==5 && TimeHour(iTime(Symbol(), Period(), i) ) == 20 )
      {
       int barShift = iBarShift(Symbol(), PERIOD_W1, Time[i]);
       if( iClose(Symbol(), PERIOD_W1, barShift) > iOpen(Symbol(), PERIOD_W1, barShift) )
         {
        l2DnBuffer[i]  = iHigh(Symbol(), PERIOD_W1, barShift);
        l2UpBuffer[i]  = iLow(Symbol(), PERIOD_W1, barShift);
         }
         else
        {
        l2UpBuffer[i] = iHigh(Symbol(), PERIOD_W1, barShift);
        l2DnBuffer[i] = iLow(Symbol(), PERIOD_W1, barShift);
         }
      }
   }
   return;
 }
what's showed up :
https://www.mql5.com/en/charts
It seem nothing special happen at the end of a week.
Traders may close winning orders and hedge loosing orders, waiting for the monday morning, but nothing can be see on the chart price ! ;-)
- Free trading apps
- Over 8,000 signals for copying
- Economic news for exploring financial markets
You agree to website policy and terms of use
Hi there, I've been fighting this thing since yesterday, tried different things, googled like a mad... I can't make it work. Let me explain:
I want an indicator that marks with a vertical line the end of different times (end of day, end of week, end of month, end of quarter). The length of the vertical line goes from High to Low of the specific period, that way I can compare the end of the period with the overall range of the period:
- End of Day (5pm NY, only visible when TF is < PERIOD_D1). The line goes from High to Low of that day. WORKS.
- End of Week (Friday 5pm. Length of vertical line is from High to Low of that week. TF < PERIOD_W1). NOT WORKING
- Month and quarter not implemented yet, I'm stack in the week one.
Honestly, I don't know why the End of Week doesn't work, the logic should be quite similar than the End of Day. This is my Start() method. Below I'll copy the whole indicator code:
The Day mark works perfectly on H1 chart (aparently) but the weekly one at NY 5pm Friday does not work and I don't know why :(. Another problem that I just realised is that bars from D1 and above might not close at 5pm NY but that is an issue I'll fight later.
My plan B is to calculate the number of bars for each period per time frame (for instance in H1 there are 118 bars per week I think) and having that number I can get High[Highest] and Low[Lowest]. But this approach is a bit more complex and not flexible.
Any help is appreciated. Thanks in advance.
#### whole indicator code, also attached