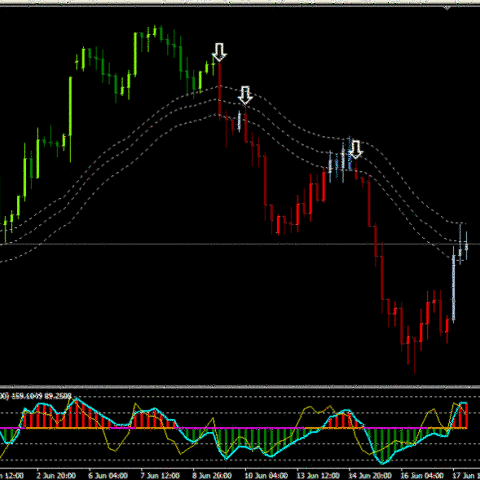
Yellowbeard: Is there a way to draw a single candle on a chart, with either a script or indicator, to represent the current candle
Your indicator uses histograms
Of course you will have scaling problem putting JPY (80 - 120) range candles on a EURUSD (1.10 - 1.50) chart and visa versa.
Raghee Horner's 34EMA Wave & GRaB Candles - Page 3 @ Forex FactoryGRaB indicator 
Sorry. I guess my question should have been, How do I draw a candle?
You can make it out of rectangles (for the body) and trend lines (for the wicks).
|
Yellowbeard: Sorry. I guess my question should have been, How do I draw a candle? | Did you bother to download the indicator and look at the source. All you need is the histogram buffers. |
Thanks, WHRoeder! Got them. Had to Google for them. Will take me a little while to figure it out. Do I need to use the EMA 34 to create the candle? Should I use a SMA 1 for current? Just want current High, Low, Open and Close for candle.
|
Yellowbeard: Do I need to use the EMA 34 to create the candle? | The EMA34 is what that indicator uses to decide color. You are the one who wants to paint the candles. You use what you want. |
Thanks, again WHRoeder! I'm sure that I can figure it out. Thank goodness for trail and error. Miss my C64.
You are missing trading opportunities:
- Free trading apps
- Over 8,000 signals for copying
- Economic news for exploring financial markets
Registration
Log in
You agree to website policy and terms of use
If you do not have an account, please register
Is there a way to draw a single candle on a chart, with either a script or indicator, to represent the current candle for a given currency pair? I would like to create a chart that displays all of the currency pairs, in one location, that are offered by my broker, with the current candle of each pair, in it's respective period. ( 5M, 1Hr. Daily etc. )
Thanks!