Please help me figure out how Maximal Drawdown is calculated in the Tester
Attaching EA code and the .CSV files which the EA uses in the test - these files tell the EA when to open and close the trades... this test EA does not have any Technical Analysis trading logic, it just follows the times to open and close trades from the files.. Like I said the purpose of this EA was to prove that I can arrive at the same values as the MT4 Tester Report.
Files:
testmaxdd.zip
15 kb
The EA actually is pretty interesting to watch while it is working it visualizes the drawdown on the chart... Uploading some pics so you can get an idea what it looks like...
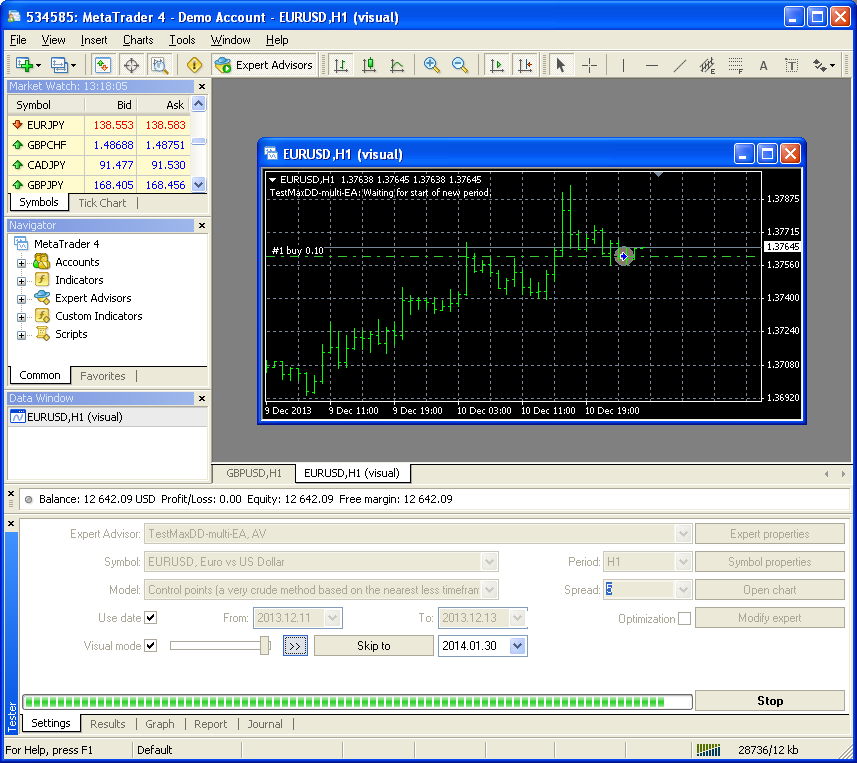


So here you can see the Max drawdowns visualized for the 2 trades that the EA took - a BUY and a SELL.
You are missing trading opportunities:
- Free trading apps
- Over 8,000 signals for copying
- Economic news for exploring financial markets
Registration
Log in
You agree to website policy and terms of use
If you do not have an account, please register
Hello
I would like to start by saying that I did read the MT4 Help page on how the Tester Report values are calculated AND that I did search the forum for "Maximal Drawdown Tester" and I did not find an answer to my problem so here goes...
Firstly I would like confirm that my understanding of Maximal Drawdown is correct and I think the easiest is to illustrate it with this picture:
During the test period the Maximal Drawdown is constantly calculated and the biggest one encountered will eventually become the value displayed in the Report. For simplicty, in this example I am taking a situation where only 1 trade is open so the drawdown of that trade will equal the maximal drawdown in the Report. If the test period includes several trades (again only 1 trade at most is active at any given time) then Maximal Drawdown in the Report should be equal to the biggest drawdown that one of these trades experienced during the test period. Finally if we can have more than 1 trade open at any given time then the situation is a little more complex (taking the sum of the drawdowns when more than 1 trade is open, etc).
But like I said - let's deal with the simplest case first, because even that does not work properly, IMO
In the picture above the two red rects represent what were the Maximal Drawdown at certain stages during the trade and eventually the YELLOW rectangle qualified as the final Maximal Drawdown of this period (it may be hard to see but the height of the Yellow rectangle is a bit bigger than the second red rectangle).
So, could someone pls confirm that the above is correct or if it is not pls tell me why or point me to a resource that explains why?
In the above example:
Given the above I would say that :
Max drawdown move was: ( Prc_dd_tN - Prc_dd_t0 ) * Lots * LOTSIZE = $34.20 USD
Max drawdown ( as % or eqty ) was: 34.20 / Equity at Time of local Max * 100
Equity at time of local Max = 10,000 + ( 1.37973 - 1.37602 ) * 100,000 * 0.1 = 10,037.10
Thus, Max drawdown ( as % or eqty ) = 34.20 / 10,037.10 * 100 = 0.0034 = 0.34%
= = =
The Tester Report, however shows that Maximal Drawdown was 40.80 (0.41%)
Compare this to my values which are, as per above calculations: 34.20 (0.34%)
hmmmm... any thoughts...? why these differences?
= = =