backtest results trade history on chart...
Is there a method to chart backtest results (the trades that occurred during the backtest) without using visual mode? If so, how do I do this?
What does happen if you click the button "Open chart" in the Setup pane of the Strategy tester?
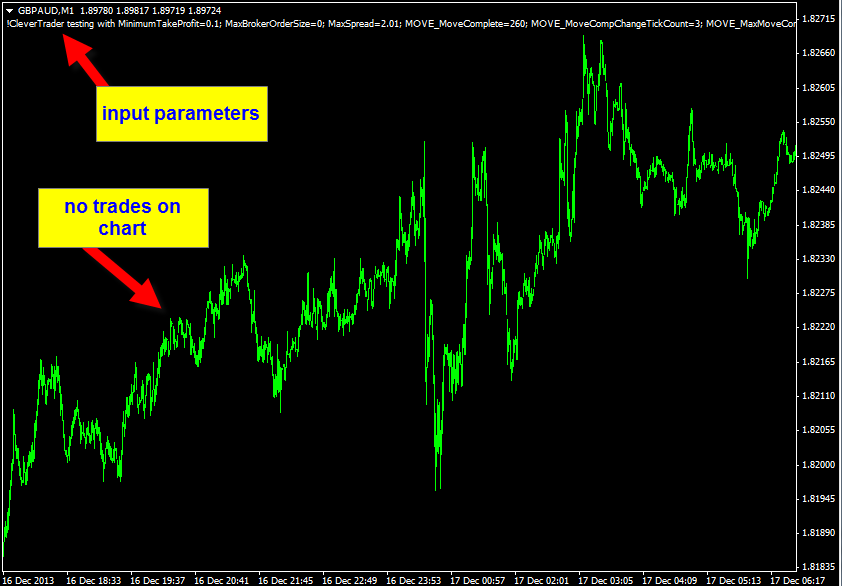
After running a non-visual backtest and it completes, I clicked on "Open Chart" and only the input parameters are shown in upper-left corner. No trades from backtest on the chart.
Now that could be affected if at the end of the backtest, the EA auto-deletes all chart objects whenever it is de-initialized. I plan to get this fixed in the next release.
Look in the MT4 market.
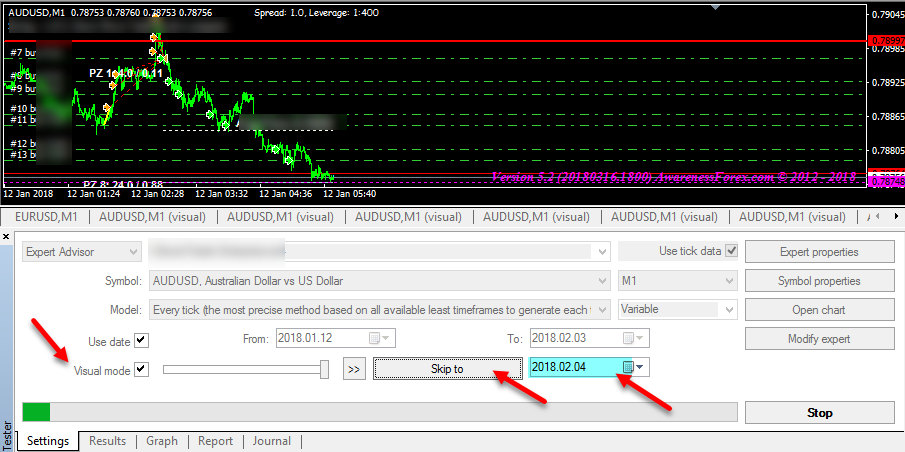
Start visual mode, enter a date near end of test, press Skip to
this could be somewhat erroneous due to how the EA works. APAMI indicator is calculated tick by tick to measure price distances. Simultaneously, grid trades can also swing from a previous entry. So when I start the EA on a certain day and at a certain time, it would temporarily have slightly different results for a few cycles of grids as the starting price was different. It would eventually even itself out, but I usually have ti give it 1-3 days prior.
I was hoping to preserve the original start date and then just view the trades after the fact.
Maybe I am wrong on this though, but that is what it looked like; the 'start from' visual mode tool would disregard data before the 'start from' date.
Now that could be affected if at the end of the backtest, the EA auto-deletes all chart objects whenever it is de-initialized. I plan to get this fixed in the next release.
I think this is the easiest solution.
Start visual mode, enter a date near end of test, press Skip to
Actually this was the answer. And you pick a date 'after' the end of test so that it will run the entire test "non-visually". You start the test in visual mode and after it starts, immediately press 'skip
to'. Make sure you don't have it paused. It runs faster in non-visual mode.
- Free trading apps
- Over 8,000 signals for copying
- Economic news for exploring financial markets
You agree to website policy and terms of use
Is there a method to chart backtest results (the trades that occurred during the backtest) without using visual mode? If so, how do I do this?
Visual mode can often sometimes take a very long time to run with tick data backtesting. The non-visual mode backtest runs much faster, but I cannot see where the trades are placed.
In a regular demo/live terminal account history, I can hold SHIFT button and drag a trade on a chart and all of the trades for that pair will be placed on the chart. I don't see why something similar couldn't be achieved with the strategy tester.