Counting Candles
Does your Renko generator create charts with valid timestamps? Then there's no difference.
As for counting how many bars for the higher time frame, try
  int    counted_bars=IndicatorCounted();
  for(int i = Bars -1 -counted_bars; i>=0;i--){
     datetime now = Time[i],
              nowTF = now - now % (60 * TimeFrame);
     period[i] = iBarShift(NULL,0, nowTF);
  }
If you want the time of a bar on a chart where the bars do not have meaningful times then you are in trouble . . .
No no, i do not want the time of a bar on renko chart. I told that i have already made this indicator for regular time related chart using the time of a bar on a chart. So yet i want to counting the number of bar on renko chart on each day. So the above code was my try to achieve this goal but no success.
Does your Renko generator create charts with valid timestamps?
No no, it does not do that at all. You know that renko is not time related chart. I told that i have already made this indicator for regular time related chart using the time of a bar on a chart. So yet i want to counting the number of bar on renko chart on each day. So the above code was my try to achieve this goal but no success.
No no, i do not want the time of a bar on renko chart. I told that i have already made this indicator for regular time related chart using the time of a bar on a chart. So yet i want to counting the number of bar on renko chart on each day. So the above code was my try to achieve this goal but no success.
You have right, but the first candle on each daily period is the starting candle . Yes this is difficult so i share it here, if some one understand what i am looking for.
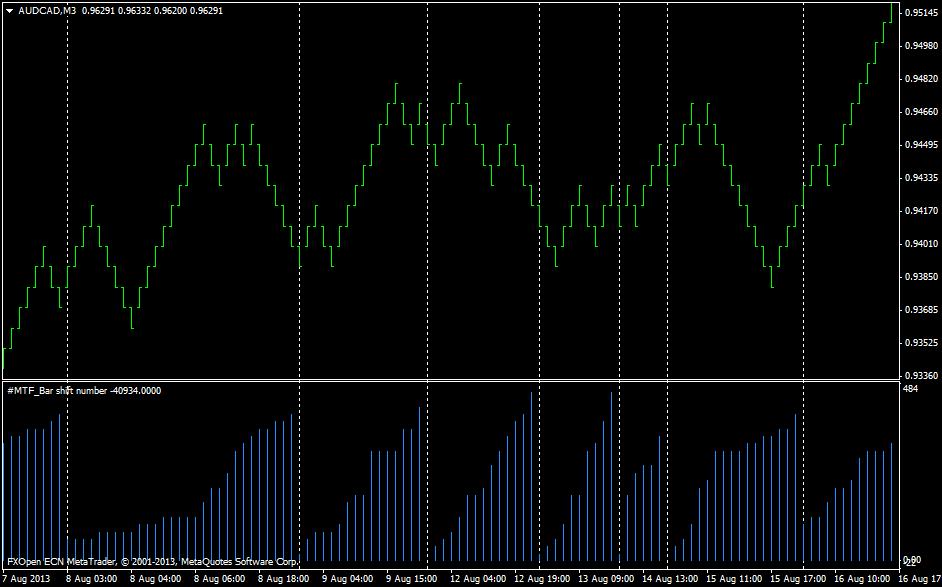
the below picture is wrong because it use time formula for counting the candle number. I want a mathematic solution on coding in mql4.
Irrelevant. A Renko creates a new bar when price exceeds its limit. The time of that tick is the time of the new bar. Every bar (renko or not) has a TOHLCV. If your generator doesn't properly set the Time of each bar, then you can't possibly find which bar starts or crosses midnight.
Yes, i am using your the same code that you send me. but if you compare both above charts, you see that this code does not generate linear graph on subwindow. That mean we need to use another code for counting bars in renko charts.
Irrelevant. A Renko creates a new bar when price exceeds its limit. The time of that tick is the time of the new bar. Every bar (renko or not) has a TOHLCV. If your generator doesn't properly set the Time of each bar, then you can't possibly find which bar starts or crosses midnight.
I don't think he needs the time for each bar. He just needs the bar count (renko bar's) to restart at a pre-given time, each day. The bars after the starting bar would not be time related, only 1 bar each day would be time related.
(note* Though renko can also be based on closing prices and a closing price is time related)
- Free trading apps
- Over 8,000 signals for copying
- Economic news for exploring financial markets
You agree to website policy and terms of use
Hi friends,
I want to calculate the candle number after and related to specific time period on current chart. For example on H1 cahrt i want to numerize the candle after 00:00 Oclock (After every day opening).
I have already make an indicator Using time formula and Ibarshift - Both of them are already done-
You can see it on below picture the already done indicator.
But if i want to do this on some syntetic charts like renko, those are price related charts and they are independed from time, I do not know how to do this. I have already make the below code for this porpuse but it does not work. Can you help me?