Discussion of article "Technical Indicators and Digital Filters"
One question: why did the author come to the conclusion that the chart in the terminal is a sum of periodic signals, in the simplest case, sinusoids? Is there any proof of this theory?
It is not the author of the article came to such a conclusion, it has long been known to everyone, since the 1800s, for more than 200 years.
By the way, the author of this theorem was also a representative of the school of utopian socialism.
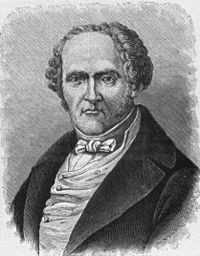
François Maria Charles Fourier
François Maria Charles Fourier
This is a different Fourier. This is ours:

One question: why did the author come to the conclusion that the graph in the terminal is a sum of periodic signals, in the simplest case, sinusoids? Is there any proof of this theory?
It is not the author of the article came to such a conclusion, it has long been known to everyone, since the 1800s, for more than 200 years.
By the way, the author of this theorem was also a representative of the school of utopian socialism.
François Marie Charles Fourier.
Fourier, as far as I remember, did not come to exactly the same conclusion. He came to the conclusion that any complex function can be represented by the sum of simpler ones, not by the sum of sinusoids. The article deals with a special case. And it would be more correct, in my opinion, to write in the article not"any curve can be represented as a sum of sinusoids", but "any periodic curve can be represented as a sum of sinusoids".
If we proceed from the assumption that quotes are periodic, then the above theory is applicable for technical analysis. If quotes have no periodicity, then the stated theory will be useless. IMHO.Fourier, as far as I remember, did not come to exactly the same conclusion. He came to the conclusion that any complex function can be represented by the sum of simpler ones, not by the sum of sinusoids. The article deals with a special case. And it would be more correct, in my opinion, to write in the article not"any curve can be represented as a sum of sinusoids", but "any periodic curve can be represented as a sum of sinusoids".
If we proceed from the assumption that quotes are periodic, then the above theory is applicable for technical analysis. If quotes have no periodicity, then the stated theory will be useless. IMHO.More simple, what kind of quotes? It is not necessary to guess, it is enough to look in a textbook or a reference book. There have been so many discussions about this periodicity and non-periodicity here, and how many times can we talk about the same thing? A non-periodic function is also decomposable, for a limited period of time it is assumed to be one period and decomposes perfectly well.
https://www.google.ru/search?ie=UTF-8&hl=ru&q=%D1%80%D1%8F%D0%B4%20%D1%84%D1%83%D1%80%D1%8C%D0%B5
- Free trading apps
- Over 8,000 signals for copying
- Economic news for exploring financial markets
You agree to website policy and terms of use
New article Technical Indicators and Digital Filters has been published:
For several years, Code Base has accumulated a large number of indicators. Many of them are copies of one another with only slight modifications. After many hours of visual comparison of indicators on the chart, we could not help but ask: "Is it possible to find more objective and efficient way of comparison?" It is possible, indeed. We should admit that an indicator is a digital filter. Let's turn to Wikipedia.
Filter (chemistry), a device (usually a membrane or layer) that is designed to physically block certain objects or substances while letting others through.
Do you agree that indicators allow blocking some "unnecessary" objects and focus on the critical ones? Now let's see what a digital filter is.
In electronics, computer science and mathematics, a digital filter is a system that performs mathematical operations on a sampled, discrete-time signal to reduce or enhance certain aspects of that signal.
In other words, a digital filter is a filter processing discrete signals. The prices we see in the terminal can be treated as discrete signals, as their values are recorded not continuously but over a certain period of time. For example, the price value is recorded each hour on H1 chart, while it is done once per 5 minutes on M5. Many indicators can be treated as linear filters. This is exactly the type of indicators that are discussed in the present article.
Now, when we found out that we are dealing with digital filters, let's examine the theory in order to define what parameters should be compared.
Author: GT788