ubzen:
You can read article here. There's part1 and part2. Part2 mostly applies to what you're looking for.
You can read article here. There's part1 and part2. Part2 mostly applies to what you're looking for.
Hello ubzen,
thank you for response.
I already read these articles, and may be I know how to create objects of rectangles, but not sure how to find these situations programmatic. From which side let the loops run? from bar0 to left or from bar[bars] to right.
If you know what I mean.
thanks a lot.
J.
Show me your coding attempt for this indicator based upon what you've read in those articles. Explain what you've tried, and what doesn't work the way you expected it to.
ubzen:
Show me your coding attempt for this indicator based upon what you've read in those articles. Explain what you've tried, and what doesn't work the way you expected it to.
Show me your coding attempt for this indicator based upon what you've read in those articles. Explain what you've tried, and what doesn't work the way you expected it to.
I have not started yet, because I don't know how to make algorithm. But Ok I have now something in my head so I try to write it post it here.
Thanks.
J.
faltajan: I have not started yet, because I don't know how to make algorithm. But Ok I have now something in my head so I try to write it post it here.
Sure, let us know if you get stuck and we'll point you in the right direction.
You are missing trading opportunities:
- Free trading apps
- Over 8,000 signals for copying
- Economic news for exploring financial markets
Registration
Log in
You agree to website policy and terms of use
If you do not have an account, please register

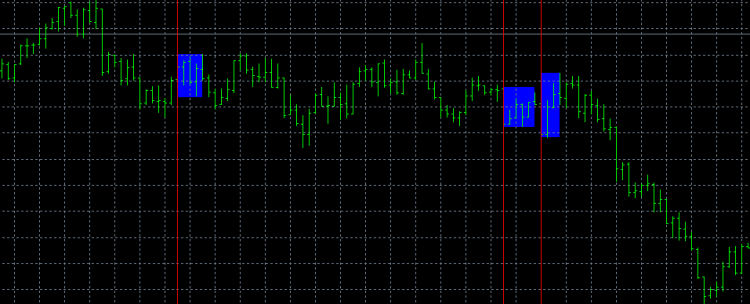
Hello, please can you give me some advice how to make this kind of indicator?
I would like to program indicator which mark situation described below by rectangle.
Situation:
if 3 or more bars have open and close price in range of the bar before these 3 or more bars (red line on chart).
see picture.
I am completely new in programming and any advice help me much.
Thank you very much.
J.