USDCAD Technical Analysis 06.10 - 13.10 : Ranging Bearish
Just something about patterns for this pair :
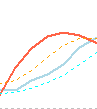
USDCAD, H12: USDCAD H12 - Gartley formed pattern for uptrend (this is formed pattern, i mean - we had uptrend for this one) :
MetaTrader Trading Platform Screenshots
MetaQuotes Software Corp., MetaTrader 5, Demo
USDCAD H12 - Gartley formed pattern for uptrend

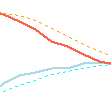
USDCAD, H4: USDCAD H4 - Gartley forming pattern for uptrend(this pattern is just forming ... for uptrend too)
MetaTrader Trading Platform Screenshots
MetaQuotes Software Corp., MetaTrader 5, Demo
USDCAD H4 - Gartley forming pattern for uptrend

newdigital, 2013.10.08 06:47
USD/CAD Still Supported on Dips
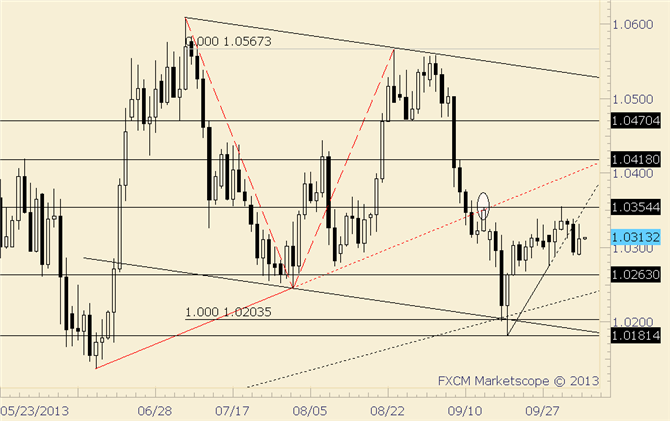
- USDCAD traded into 1.0355 last week. That level is significant because it is the 9/13 high, which was a Friday before a gap lower. As long as price is below that level, I’ wary of the long side.
- The advance from the 9/19 low began impulsively, but momentum slowed considerably from the 9/24 low. A test of that level could complete a flat pattern.
Trading Strategy: Flat
LEVELS: 1.0181 1.0232 1.0264 | 1.0336 1.0355 1.0409
:)
MetaTrader Trading Platform Screenshots
MetaQuotes Software Corp., MetaTrader 5, Demo
zigzag'ing waves :)

This is real example of ranging bearish - look at the images :

Just to remind :
1. Trend following
1.1. Primary trend
- Uptrend (bullish)
- Downtrend (bearish)
1.2. Secondary trend.
- Correction
- Bear Market Rally
- Flat (non-trading)
- Ranging
2. Overbough/oversold ('top-and-bottom')
3. Breakout
As we are talking about AbsoluteStrength indicator to define the market condition so it is about how to use this indicator :
newdigital, 2013.07.01 21:04
How can we know: correction, or bullish etc (in case of using indicator for example)?
well ... let's take AbsoluteStrength indicator from MT5 CodeBase.
bullish (Bull market) :
bearish (Bear market) :
ranging (choppy market - means: buy and sell on the same time) :
flat (sideways market - means: no buy and no sell) :
correction :
correction in a bear market (Bear Market Rally) :
newdigital, 2013.10.10 17:53
Price & Time: Cycle Turn Windows Coming Up in Several Instruments
Talking Points
- Cycle turn window in the S&P 500 coming up
- USD/CAD nearing important time resistance
- Euro holding over key support level
Price & Time Analysis: USD/CAD
- USD/CAD touched its highest level in almost a month and a half on Thursday before finding resistance at the 4th square root progression of the 2Q low in the 1.0410 area
- Our near-term trend bias remains higher while above the 3rd square root progression of the year’s high near 1.0300
- The 1.0410 area is clearly and important resistance zone a daily close over this level would setup further strength towards attractions at 1.0455 and above
- An important medium-term cycle turn window is seen Friday and Monday
- A move under 1.0300 at anytime will turn us negative on Funds
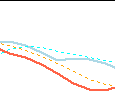
This is the example of ranging market condition +11/-11 pips ranging :
MetaTrader Trading Platform Screenshots
MetaQuotes Software Corp., MetaTrader 5, Demo
11 pips by ranging

This kind of market condition is very good for martingale and scalping for example.
MetaTrader Trading Platform Screenshots
MetaQuotes Software Corp., MetaTrader 5, Demo
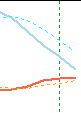
+18 and -18 pips movement by CAD - Unemployment Rate

newdigital, 2013.10.11 15:03
2013-10-11 12:30 GMT (or 14:30 MQ MT5 time) | [CAD - Unemployment Rate]
- past data is 7.1%
- forecast data is 7.1%
- actual data is 6.9% according to the latest press release
if actual < forecast = good for currency (for CAD in our case)
==========
Canadian unemployment rate drops to 6.9% – USD/CAD falls
Canada gained 11.9K jobs in October, a small disappointment. It was expected to show a gain of 15.3K jobs after the huge jump of 59.2K last month. The unemployment rate was expected to remain unchanged at 7.1%, but this surprised with a drop to 6.9% – an unemployment rate unseen in a long time. In recent months, employment data was quite volatile.
USD/CAD traded just under 1.04 towards the publication. It is now under 1.0380.
The participation rate dropped from 66.6% to 66.4% and this explains the drop in the unemployment rate. However, the report is good not only because of the unemployment rate but also due to the composition of jobs: Canada gained no less than 23.4K full time jobs and actually lost 11.5K part time jobs. These are signs of a healthy economy.
The Canadian dollar suffers from the political deadlock in the US: the Canadian economy depends on the strength of the US economy and a weaker economy due to the government shutdown and the fear of a default due to the debt ceiling certainly weigh on the loonie, even if oil prices are doing well.
1.0360 provides some support and 1.0446 is the line to watch on the topside.- Free trading apps
- Over 8,000 signals for copying
- Economic news for exploring financial markets
You agree to website policy and terms of use
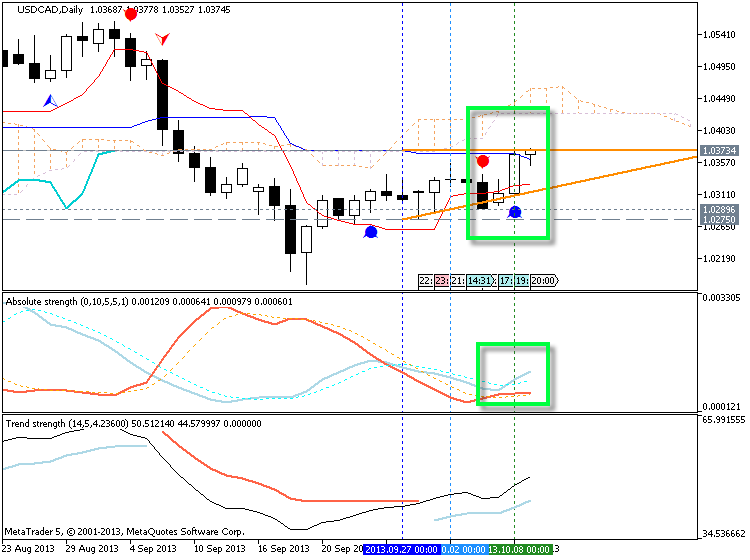
The price is below Ichimoku cloud for trying to break few very strong resistance levels on the way (D1 timeframe).
Chinkou Span line is crossing historical price on H4 timeframe on open bar, and price came to inside Ichimoku cloud which is indicating ranging market condition as a secondary trend. The upper border of Ichimoku cloud is Sinkou Span A line so the price came to bearish zone of the market for H4 timeframe. Ranging bearish. for D1 timeframe but the price is still above Ichimoku cloud which is indicating possible secondary correction within primary bullish market condition.
If the price will break 1.0269 support level from above to below so the bearish primary trend will be continuing for D1 timeframe; otherwise - ranging.
UPCOMING EVENTS (high/medium impacted news events which may be affected on USDJPY price movement for this coming week)
2013-10-07 12:30 GMT (or 14:30 MQ MT5 time) | [CAD - Building Permits]
2013-10-08 12:15 GMT (or 14:15 MQ MT5 time) | [CAD - Housing Starts]
2013-10-08 12:30 GMT (or 14:30 MQ MT5 time) | [CAD - Trade Balance]
2013-10-10 12:30 GMT (or 14:30 MQ MT5 time) | [CAD - NHPI]
2013-10-11 12:30 GMT (or 14:30 MQ MT5 time) | [CAD - Unemployment Rate]
Please note : some US high impacted news events (incl speeches) are also affected on USDJPY movement
SUMMARY : bearish
TREND : ranging
Intraday Chart