Maximal Drawdown period
no way with original MT4 functionality. the MT4 generated equity graph is of little use. generate it by yourself to get a clearer picture about what's going on during a test.
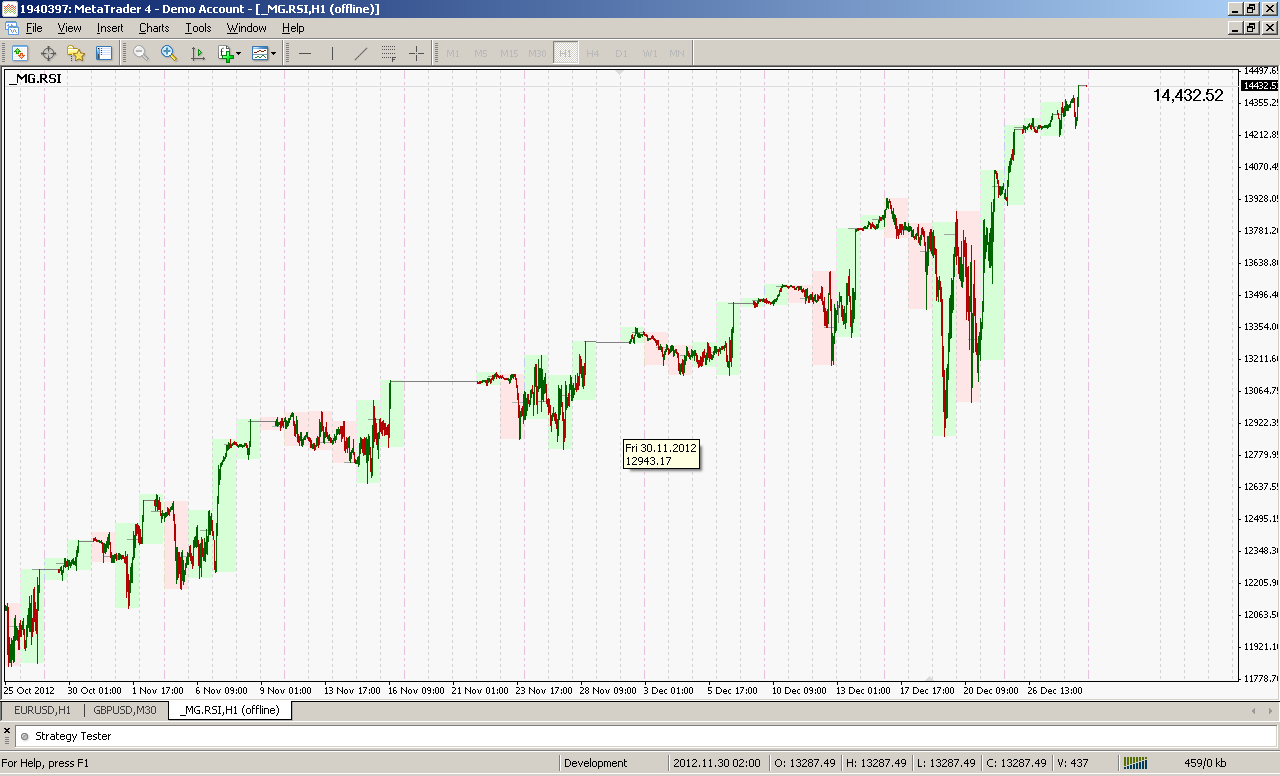
generated equity graph from a RSI-Martingale EA test run.
btw: not possible in MT5. one more reason to not switch...
Sharmway: ...Is there a made EA / Script for it ?
There can't be a ready-made EA or script because the tester can only run one EA at a time (your strategy). It's a library you have to integrate in the EA under test, so you need proper programming skills to use it.
The following code is to demonstrate how the library is used. It will *not* compile because of missing dependencies.
Files:
Ah, ok. That cant be done, as i'm testing a commercial EA ... Thank you for your time.
You are missing trading opportunities:
- Free trading apps
- Over 8,000 signals for copying
- Economic news for exploring financial markets
Registration
Log in
You agree to website policy and terms of use
If you do not have an account, please register
Hi !
Is there a way to check - other than manually browse through the report - which was the period that contains the maximal drawdown ? It would be even better to get a list of the drawdowns, with dates ( maximal, second maximal, third, etc ).