SetIndexStyle(0,DRAW_LINE,DRAW_SECTION,2);
2nd parameter is a DRAW 3rd parameter is a STYLE#property indicator_buffers 1 // Missing prop. is my guess. #property indicator_level1 0 #property indicator_separate_window #property indicator_color1 White
Hi
i ve got the following code of a custom indicator. What s doing is plotting the Close of the current bar timeframe as an indicator on a separate window for the first 180 bars only.
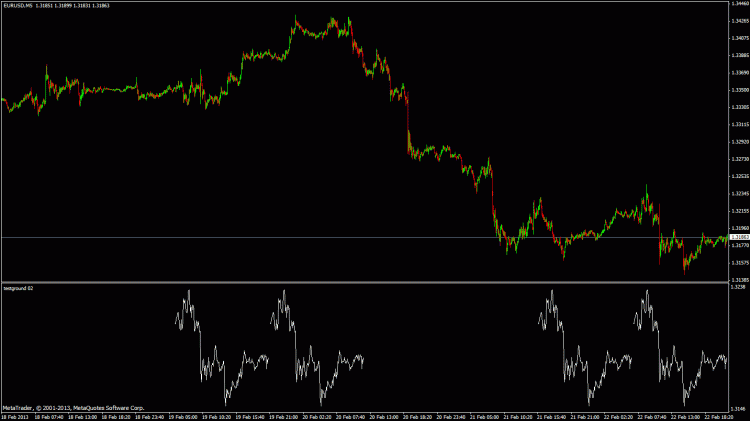
The problem is that for some reason - cant figure out - there is an image of the buffer after a while like the image bellow. That happens in any timeframe.
here is the full code:
I suspect it has to do with the limit i set as a history in the candles or something... but cant really get it. Its a really strange bug!
Any help?
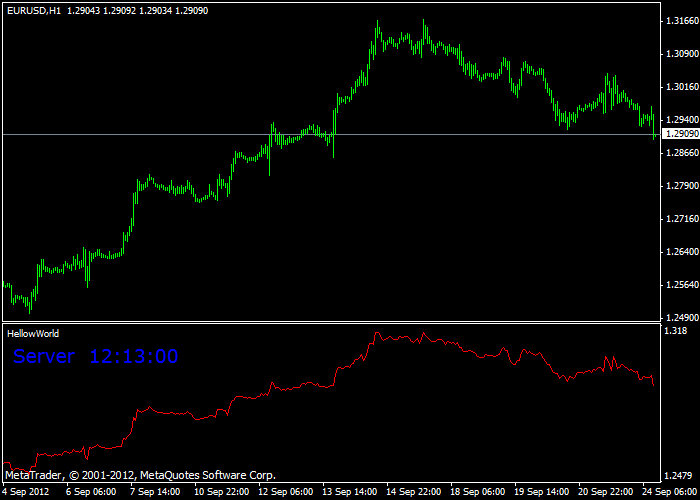
Do you know indicator Hello World made by Heelflip. Topic where you can find it.....

https://forum.mql4.com/44209#532950 See how you make it right
thanks.
i made both of the changes but the problem is still there.
SetIndexStyle(0,DRAW_LINE,0,1,indicator_color1);
WHat i ve discovered is that when i first load the indicator it shows fine till i scroll back to the very very end of the chart (using page Down key). Then when i scroll back to the beginning it shows the problem.
As more times i scroll back to the very very end of the chart the more times this error repeats.
Yes I have had this before, I think it is downloading new data when you scroll back, change timeframe and back and that will sort the display issue . . . I never satisfactorily fixed my issue. https://www.mql5.com/en/forum/135231
if (candles>history-1)                             // If too many bars ..
        {
            candles=history-1;
ArrayInitialize(Buf_0, EMPTY_VALUE); // Clear old values on history update.
Yes I have had this before, I think it is downloading new data when you scroll back, change timeframe and back and that will sort the display issue . . . I never satisfactorily fixed my issue. https://www.mql5.com/en/forum/135231
thanks. at least i know that changing TF fixes the problem.
thanks. at least i know that changing TF fixes the problem.
- Free trading apps
- Over 8,000 signals for copying
- Economic news for exploring financial markets
You agree to website policy and terms of use
Hi
i ve got the following code of a custom indicator. What s doing is plotting the Close of the current bar timeframe as an indicator on a separate window for the first 180 bars only.
The problem is that for some reason - cant figure out - there is an image of the buffer after a while like the image bellow. That happens in any timeframe.
here is the full code:
I suspect it has to do with the limit i set as a history in the candles or something... but cant really get it. Its a really strange bug!
Any help?