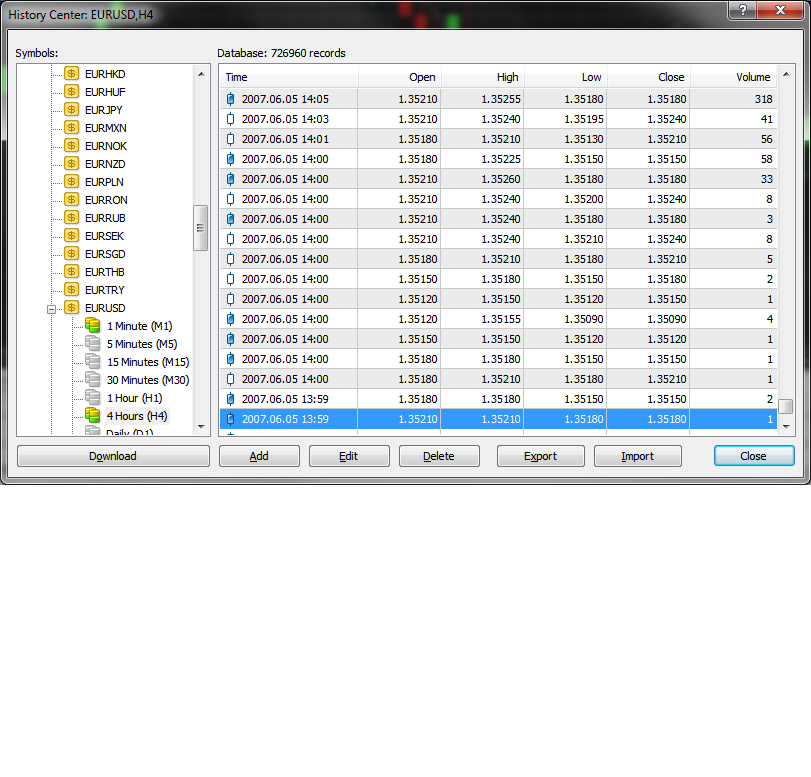
Strange trading arrows when backtest with "Open Price"
Only happens when "Open Price" but not "Every tick". Is it because of my data? Any idea?
Bearing in mind you are using non standard bars and only you know your strategy I think you are the only person able to investigate and determine what is going on. Debug it properly and determine what is happening.
Bearing in mind you are using non standard bars and only you know your strategy I think you are the only person able to investigate and determine what is going on. Debug it properly and determine what is happening.
ok. thanks for letting me know this should be my own problem. Thanks!!!
ok. thanks for letting me know this should be my own problem. Thanks!!!
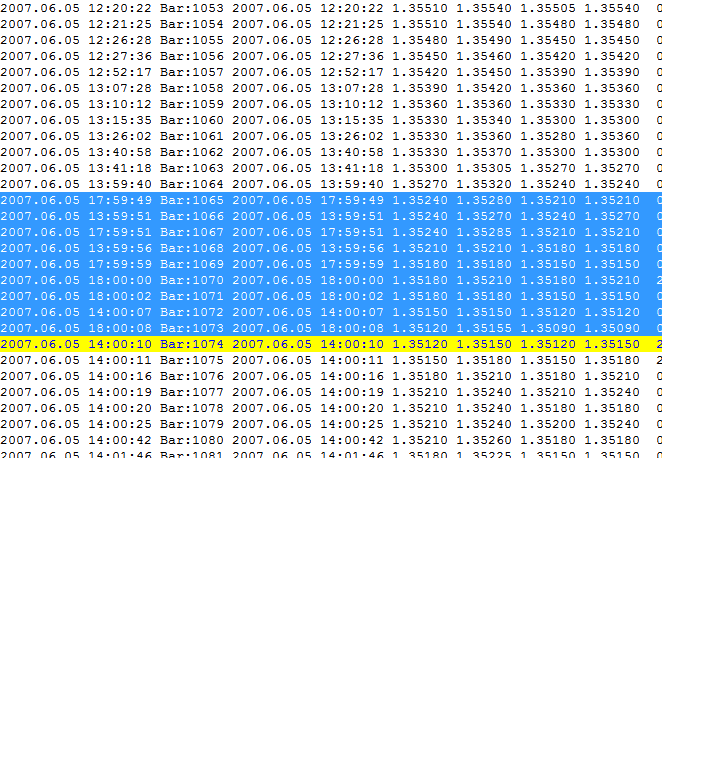
This problem is caused by time errors, i mean mt4 cannot perfectly handle more bars opening in the same minute. Replace date and time columns of this renko chart data with a normal time based chart's ones, and import it back to mt4. It should solve the "open prices test " problem, but then i think each tick mode backtests won't be possible with such data.
so this is caused by odd bid/ask in the data source (maybe because the spread is larger than a renko bar already). Need to think how to overcome this, by either enhancing the Tick converter to renko to ignore such weird ticks, or do some tricks in the strategy.
This problem is caused by time errors, i mean mt4 cannot perfectly handle more bars opening in the same minute. Replace date and time columns of this renko chart data with a normal time based chart's ones, and import it back to mt4. It should solve the "open prices test " problem, but then i think each tick mode backtests won't be possible with such data.
You're correct. I add debug log and trace the timestamp and OHLC of each bar. The no. of bars and OHLC are correct, and just the timestamp is incorrect. I'm thinking how to twist things to make them look correct. Your suggest is one way but involves quite some effort to remake all my history files. But if I twist my program (fortunately I don't have indicator based on time yet), I don't think I can twist the chart display. um......................... And not sure what's the MT4 constraint. 14:00 isn't the minute with the most ticks........... Let me find another time other than this and investigate the common points.

I recommend using time and range based noise filtering methods, because getting really accurate results backtesting on classic renko chart is very hard.
Try the attachment, it does not emulate on offline chart, only converts some kind of range bar chart using ohlc prices only, and writes a ready-to-import .csv file.
You have to make it's backtest on any timeframe (M1 or M5 recommended), using "open prices only" mode, there is no need for ticks.
- Free trading apps
- Over 8,000 signals for copying
- Economic news for exploring financial markets
You agree to website policy and terms of use
Only happens when "Open Price" but not "Every tick". Is it because of my data? Any idea?