What is the correct formula for CCi ?!
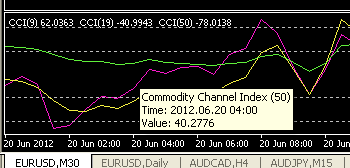
I use three CCi's - Pink(9), Yellow(19), Green(50)
I use the known formula - iCCI(Symbol(),PERIOD_M15,9,PRICE_CLOSE,0);
Oddly, when I calculate the relative condition between the three CCi(s), I get a different result then it show on the graph.
In the following example, I ask to know when the CCi(9) is crossing upwards the other two.
I get a sound and alert that such a cross happened, but it clearly shows on the graph that the cross did not happen yet.
Both, the graph and the formula use 'Close_Price'.
What is the reason of this difference and what can I do to correct it?
James
Period_M15 on M5 ... eh ?
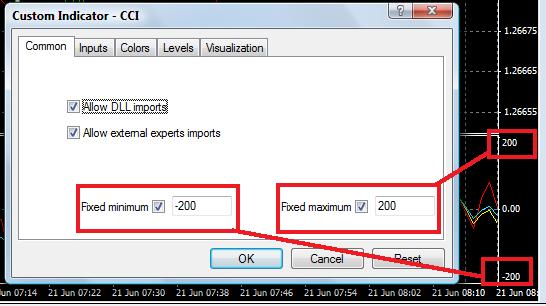
I couldn't believe you are asking this to us James, you could solve this all by yourself. Why don't you screenshot to the right side of the chart. CCI does not have indicator max and min values like RSI. In RSI you can find this parameters
#property indicator_minimum 0
#property indicator_maximum 100
And it show the first time you attach the RSI and CCI

Why don't you set all three of your CCI to say max/min 400/-400. The risk is when the line goes outside 400/-400, you won't see it.
:D
Period_M15 on M5 ... eh ?
I couldn't believe you are asking this to us James, you could solve this all by yourself. Why don't you screenshot to the right side of the chart. CCI does not have indicator max and min values like RSI. In RSI you can find this parameters
And it show the first time you attach the RSI and CCI
Why don't you set all three of your CCI to say max/min 400/-400. The risk is when the line goes outside 400/-400, you won't see it.
:D
My mistake. the actual period was indeed M5 when the screen shot was taken,
but as I corrected, it happens also with all other periods.
The levels are -200, -100, 100, 200. I mark them on the indicator face.
Beleive me when I say that this happens.
Attached another (full view) of my CCi indicator.
James
My mistake. the actual period was indeed M5 when the screen shot was taken,
but as I corrected, it happens also with all other periods.
The levels are -200, -100, 100, 200. I mark them on the indicator face.
Beleive me when I say that this happens.
Attached another (full view) of my CCi indicator.James
Dear James,
Mark max/min for all of CCI with the same value. For Pink(9) its 200/-200, for Yellow(19) also 200/-200, and for Green(50) it's the same 200/-200.
:D
Dear James,
Mark max/min for all of CCI with the same value. For Pink(9) its 200/-200, for Yellow(19) also 200/-200, and for Green(50) it's the same 200/-200.
:D
I did what you advised me to do.
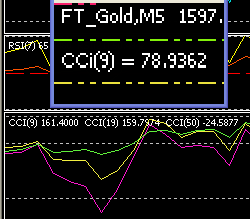
I set minimum & maximum values for all the CCi(s), It did no make much difference.
Attached is another screen shot that shows a closeup of the huge difference
from the formula value: 78.9362 compare to the indicator value: 161.4000
This difference is not constant. It varies according to the specific currency and the candle's period.
AFAIK, the mistake is with the EA formula, not with the indicator's value.
James
I did what you advised me to do.
I set minimum & maximum values for all the CCi(s), It did no make much difference.
Attached is another screen shot that shows a closeup of the huge difference
from the formula value: 78.9362 compare to the indicator value: 161.4000
This difference is not constant. It varies according to the specific currency and the candle's period.
AFAIK, the mistake is with the EA formula, not with the indicator's value.
James
Dear James,
Thank you for updating us. My apology that I didn't get what you mean in the first place. However I think I find the problem.
Your EA is using PRICE_CLOSE, while CCI indicator is using PRICE_TYPICAL.
Just open CCI indicator on MetaEditor and look for iMA () function, it's using PRICE_TYPICAL.
And please update us again.
J
- Free trading apps
- Over 8,000 signals for copying
- Economic news for exploring financial markets
You agree to website policy and terms of use
I use three CCi's - Pink(9), Yellow(19), Green(50)
I use the known formula - iCCI(Symbol(),PERIOD_M5,9,PRICE_CLOSE,0);
(sorry, in this example it is M5 not M15 - but the difference shows in all periods)
Oddly, when I calculate the relative condition between the three CCi(s), I get a different result then it show on the graph.In the following example, I ask to know when the CCi(9) is crossing upwards the other two.
I get a sound and alert that such a cross happened, but it clearly shows on the graph that the cross did not happen yet.
Both, the graph and the formula use 'Close_Price'.
What is the reason of this difference and what can I do to correct it?
James