Can anybody explain this abnormal circumstance ?
sonthanhthuytu:
The value you see when you put your cursor close to the line is just an indicative value . . . zoom in or out and do the same thing again, the value will change . . . if you want to see the actual value of the line first select it then right click on it and click Horizontal line properties then click Parameters
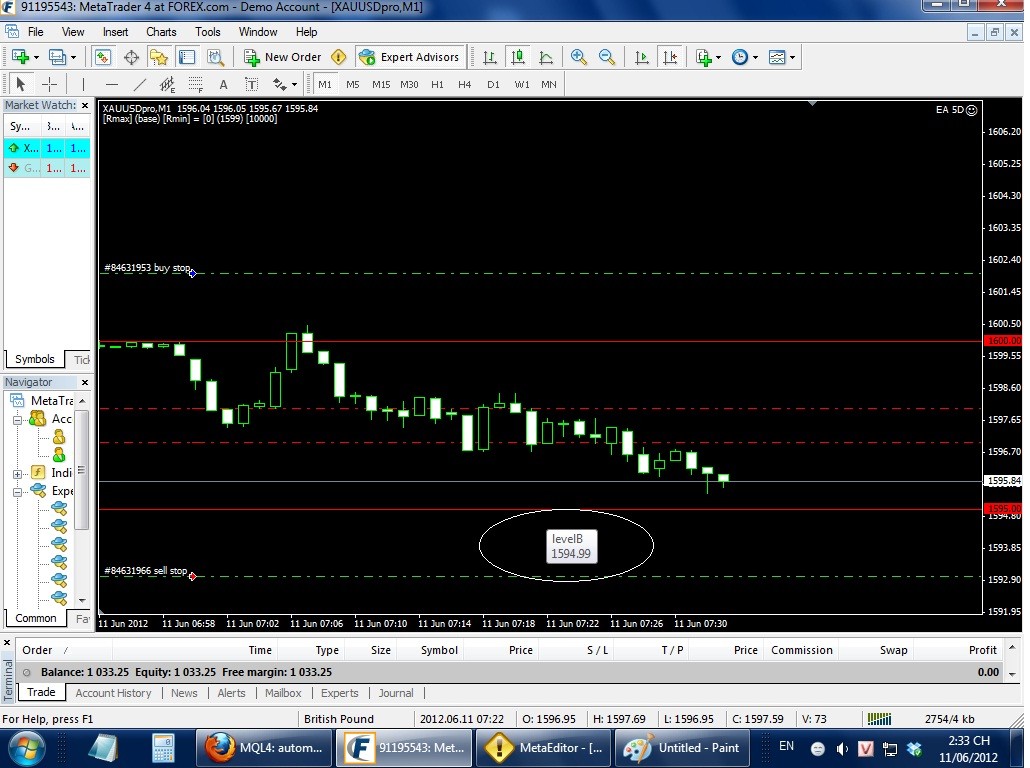
The strange thing is that when I put the mouse cursor on the line named level B on the chart, it show of uneven double value (1594.99)
instead of the even double value as shown at the price tick (1595.00)
why is there this differrence ?
Thank you.
You are missing trading opportunities:
- Free trading apps
- Over 8,000 signals for copying
- Economic news for exploring financial markets
Registration
Log in
You agree to website policy and terms of use
If you do not have an account, please register
I have coded the following function
And I have called the above function by
And the output is shown as PrintScreen file attached.
The strange thing is that when I put the mouse cursor on the line named level B on the chart, it show of uneven double value (1594.99)
instead of the even double value as shown at the price tick (1595.00)
why is there this differrence ?
Remark that I declare "levelB" variable as "int type"