The visible buffers are automatically initialized, when you call SetIndexBuffer(0, xxxBuffer);
Counting buffers can be initialzed the same way, but you have too many of them (limit is 8, and there is 4 visible buffer also).
I can see 2 possible solution:
1. using simulated indicator buffers, as described here: http://www.forexfactory.com/showthread.php?t=165411
2. as I see, you never use past values of these buffers, so define and use them as normal variables, without any indexing.
hi, thanks all your help. i just want to find out the different prices in one cell from different MA lines. however, i get the answer to do. i just do it simply in the EA code, not a indicator need. i just think price difference will show if it is the range bound period presently.
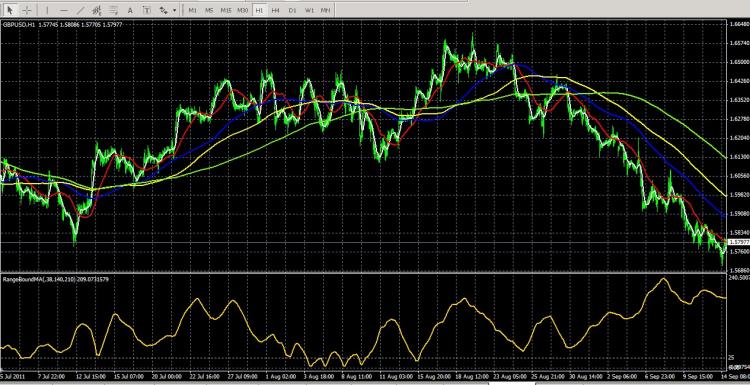
as this picture.
the indicator called rangeboundma. it from the price different among 38,140,210 SMA lines. when we see the indicator line always under 25, we say it is the range bound period. what is the next happen? the chart will sure not be always in the range bound period, it must will be break in some time. what we should do now? we just need to find the price channel now and wait during the range bound period to see which direction it will go. up or down. also, i find it always has a fake break before real break after the range bound period. that is the new think. i still going to improve it.
welcome to discuss about it.
here i share this indicator for communication each other.
thanks.
for the cellmadif code, i do it in the EA,
void MidMAHighDif()
{
for(int k=0;k<barsincell-1;k++)//32根bars里面算出快线的最高点
{
midhigh32=iMA(NULL,0,MidSMA,0,MODE_SMA,PRICE_CLOSE,0);
if(iMA(NULL,0,MidSMA,0,MODE_SMA,PRICE_CLOSE,k)>=midhigh32) midhigh32=iMA(NULL,0,MidSMA,0,MODE_SMA,PRICE_CLOSE,k);
}
// Print("midhigh32="+midhigh32);
for(int j=barsincell;j<barsin2cell-1;j++)//64根bars里面算出快线的最高点
{
midhigh64=iMA(NULL,0,MidSMA,0,MODE_SMA,PRICE_CLOSE,j);
if(iMA(NULL,0,MidSMA,0,MODE_SMA,PRICE_CLOSE,j)>=midhigh64) midhigh64=iMA(NULL,0,MidSMA,0,MODE_SMA,PRICE_CLOSE,j);
}
// Print("midhigh64="+midhigh64);
midmahighdif=(midhigh32-midhigh64)/Point/10;//为正表示140倍均线网格内最高值创新高
// Print("midmahighdif="+midmahighdif);
}
to see if new high price in this cell than the passed one. barsincell=32 for period M15.
- Free trading apps
- Over 8,000 signals for copying
- Economic news for exploring financial markets
You agree to website policy and terms of use

hi,
this is a new indicator that i made to see how the MA lines changes.
it is not the first indicator i created, but no lines in the seperate window. i checked the code again and again but still nothings wrong found.
i copy the code to mql file named "test" and test it work well.
anyone who please can help to check it and show me what is the problem. thanks.