Help with Indicator Envelopes
You are missing trading opportunities:
- Free trading apps
- Over 8,000 signals for copying
- Economic news for exploring financial markets
Registration
Log in
You agree to website policy and terms of use
If you do not have an account, please register
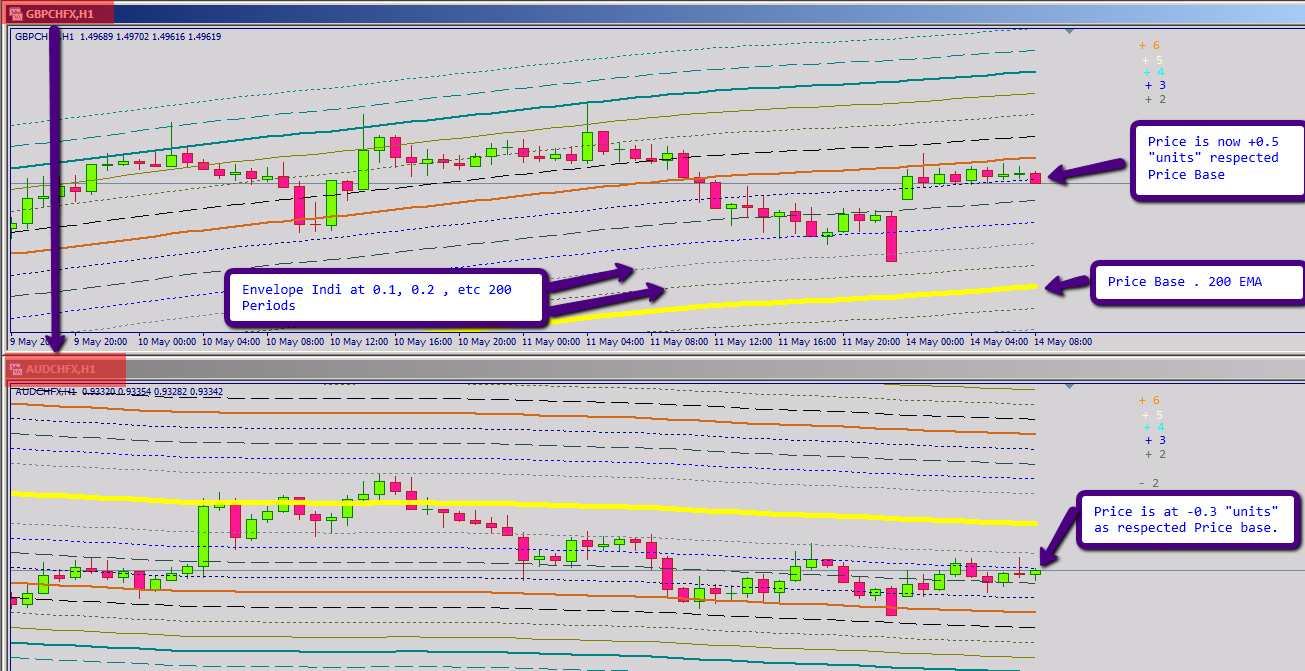
1.- We set envelopes indi at 0.1, 0.2 until 2.0, Period 200 EMA
2.- Previusly we choose two pair with positive correlation, lets say AUDCHF and GBPCHF
3.- We took as "base price" EMA 200
4.- So, In case of AUDCHF, according picture, we can meter/read +0.5 "units" from base price
5.- GBPCHF as well it is a reading of -0.3 "units".
6.- We need to plot/draw a indicator that show us the diference between pair 1 and pair 2, this case 0.5 - (-0.3 ) = +0.8
7.- I try to develop wich was the average of such "units diference" and try to enter buy/sell according such readings.
8.- May be +1.2 or -1.2 be the correct timing diference or +1.8 or -1.8, but visually is tired to see.
So, Can somebody make a indicator that plot :
a) Units from pair 1 to "base price" ? AND
b) Units from pair 2 to "base price" ? AND
c) Diference between pair1-pair2 ??
Please note, if price is above EMA200 then we assume "positive units" and, if below of ema200 then is "negative units"
Also note each "step" of each "unit" is diference for each pair. This value is granted by envelope indi.
Thanks in advance. Hope I made clear the explication.