Chart Representation Fault
I downloaded the MetaTrader4 Software from "https://www.metaquotes.net/en". I downloaded also their quotes for EUR/USD in the history center.
Please take a look at the attached screenshots and the template. Compare it, there are many differences! But why?All I see are minor differences in extremes. The history center is the worst source compared to other brokers.
There is no ONE source for FX market. Every broker will have minor differences.
All I see are minor differences in extremes. The history center is the worst source compared to other brokers.
There is no ONE source for FX market. Every broker will have minor differences.
oh sorry, but thats not "minor" differences!!!!!!!!
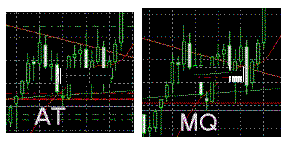
....look at the highs / the lows !!! Or look at the down-trend. In the MQ chart it is under the upper down-trend-line, but not in the AT chart.
Please can someone give me a more detailed explanation!?????
I see the same chart with different highs.
- Free trading apps
- Over 8,000 signals for copying
- Economic news for exploring financial markets
You agree to website policy and terms of use
I would be very happy if someone could help me with the following question!
I downloaded the MetaTrader4 Software from "http://www.metaquotes.net/en". I downloaded also their quotes for EUR/USD in the history center.
Then i I drew a some chart / trendlines and made a template of these drawings.
Now i also downloaded the MetaTrader4 from ActivTrades and did the same! I used the "template" which i drawed in the MetaQuotes MT4 Software.
Please take a look at the attached screenshots and the template. Compare it, there are many differences! But why?
Whats going wrong? Chart Analysis would make no sense any more!
Can someone explain this? Which one is correct? Please help!