Indicators: TF Adaptive Moving Average
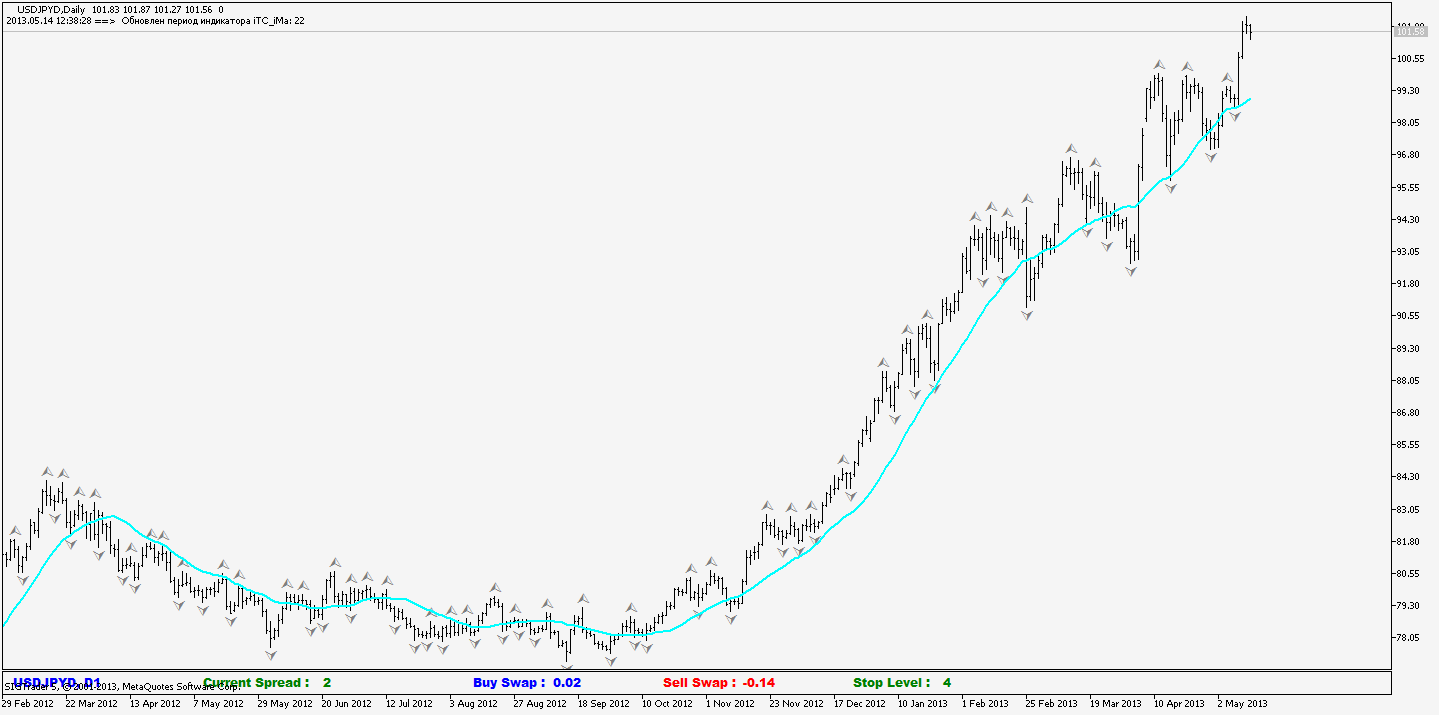
This type of moving average helps to understand on which TF the price tends to grow, and on which TF it should be sold. So that there is no "confusion in TFs". For example USDJPY on D1 is in the buy zone. But we can clearly see the support line in case the price falls. That is, the price can fall to the line itself. See the picture
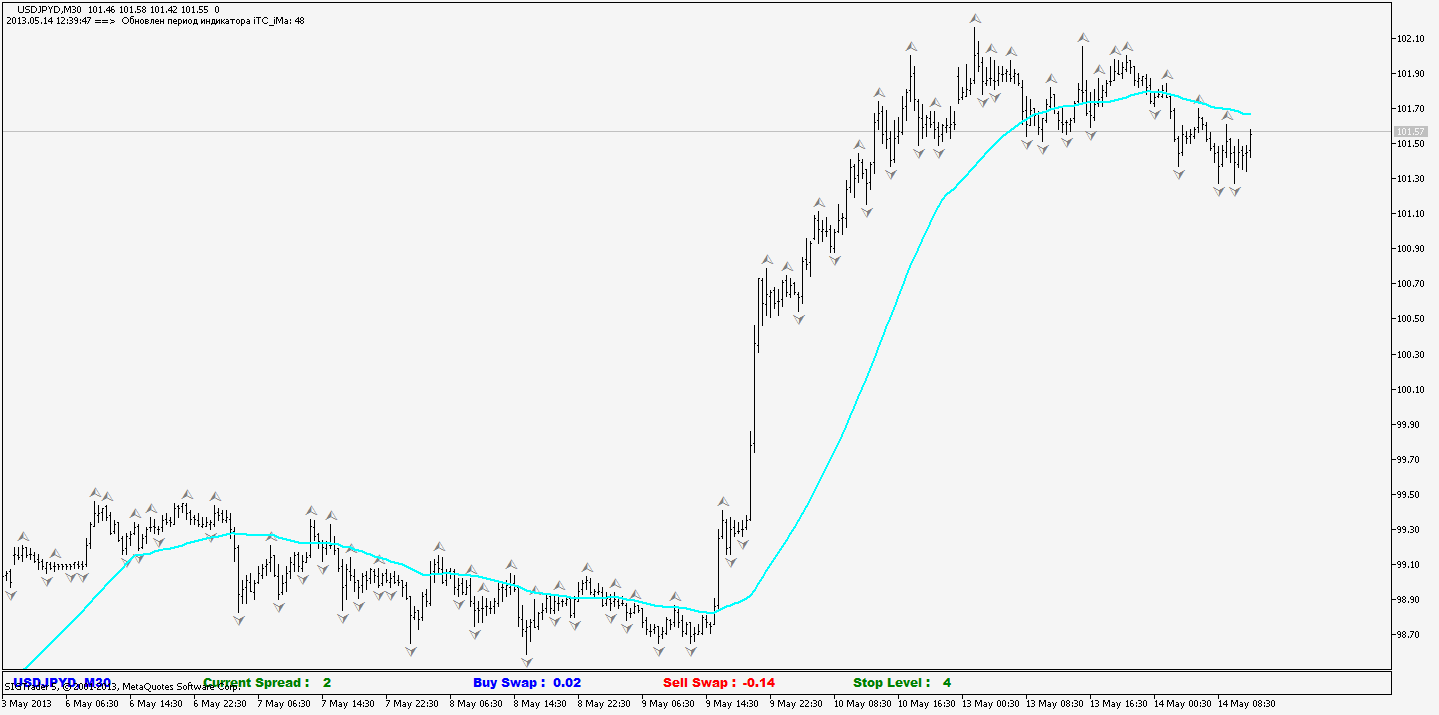
Looking at M30 - there is a good place for selling when approaching the iMA
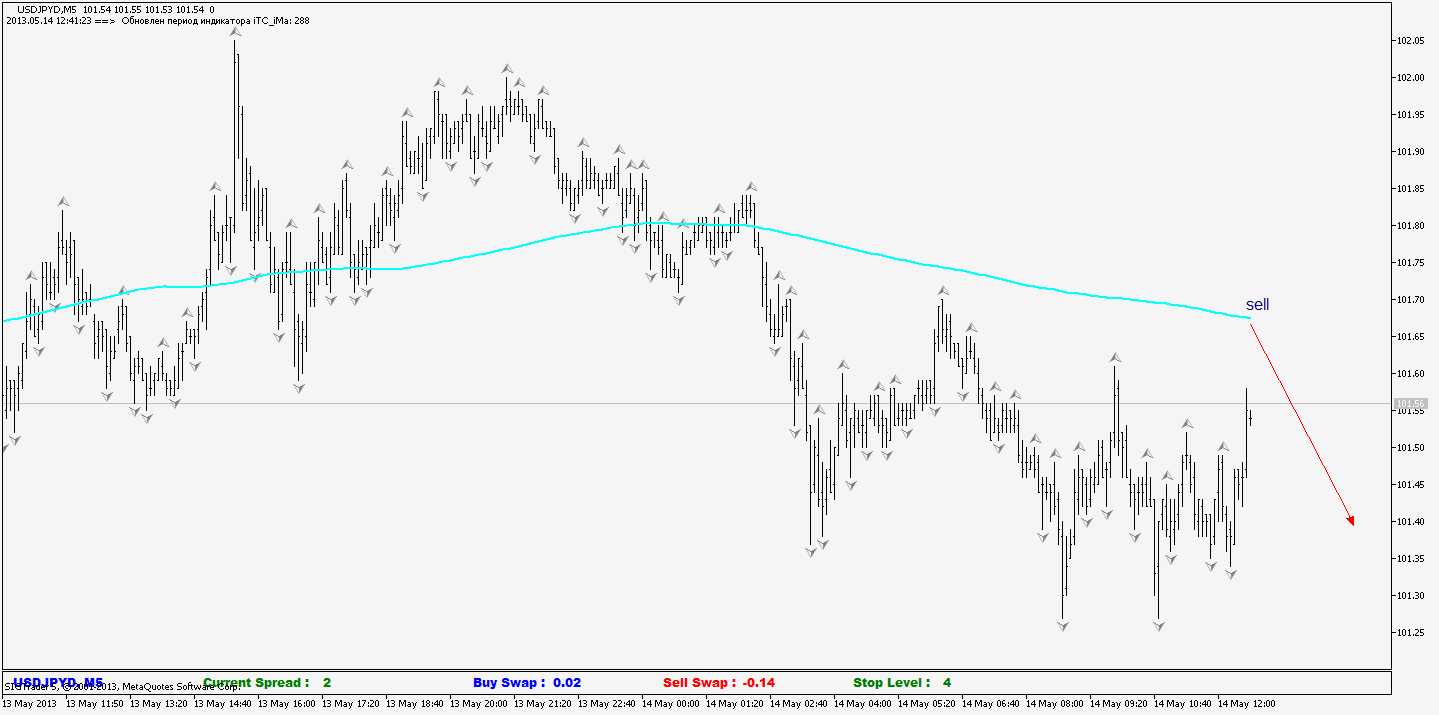
All small periods are also looking to sell now.
It's very simple. It is not necessary to search for the right period of the average for each TF. The indicator does it itself and adapts to the TF, showing the average price value and compares it with the current price, which is the most important indicator of what is happening in the market now.
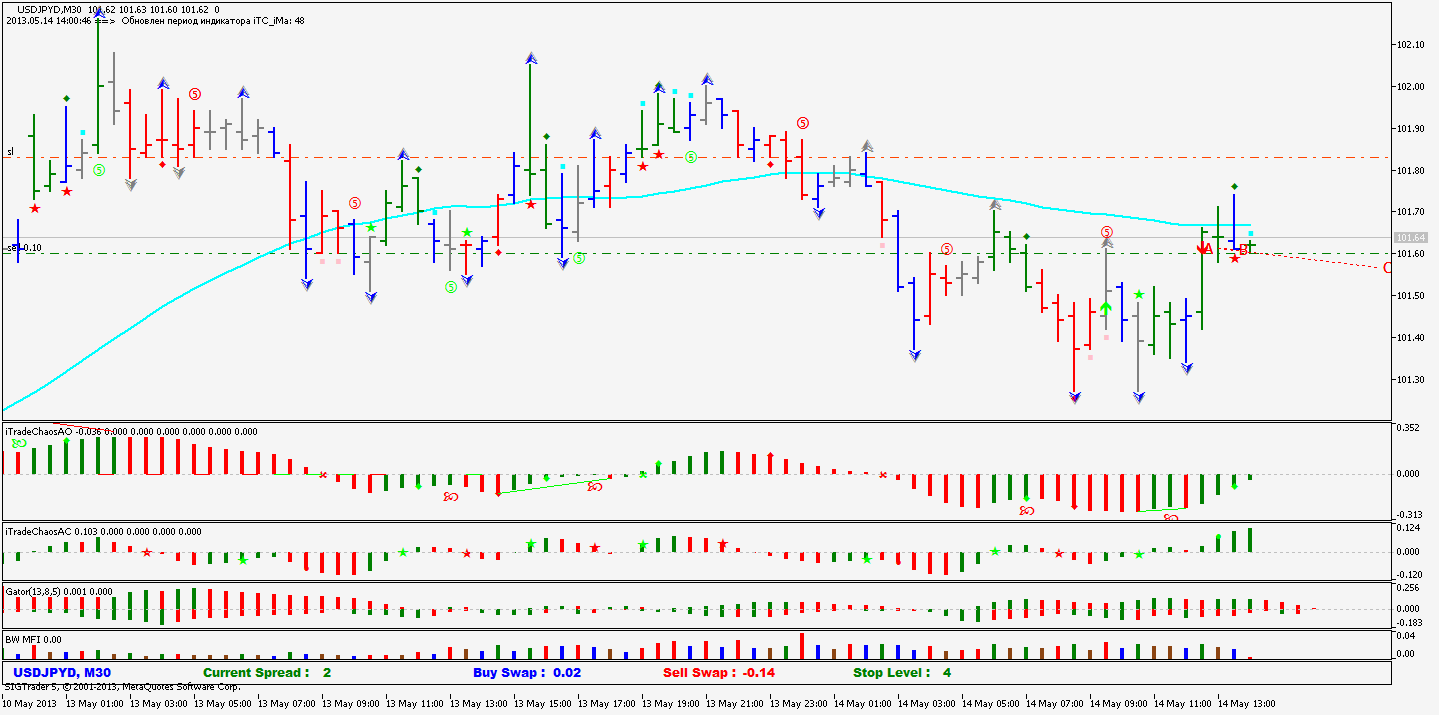
A good point for entry into sales was found on thirty minutes. Test of the adaptive line from below and formation of the reversal "SCUAT" bar downwards. Stop is defined.
That's roughly what this Rezviakov interview is about.
Nice indicator, could you do it for MT4 platform?
- Free trading apps
- Over 8,000 signals for copying
- Economic news for exploring financial markets
You agree to website policy and terms of use
TF Adaptive Moving Average:
One of the variants of a simple moving average of close prices, which automatically adapts to the chart period and shows the average value of the price for each of the 21 ranges provided in MT5. Comparing the current price with the average price value for a particular trader selected period.
Author: Gennadiy Stanilevych