USDCAD Technical Analysis 16.06 - 23.06 : Ranging
new daily bar was opened but it is floating inside Ichimoku cloud so ... waiting for
2013-06-19 12:30 GMT | [CAD - Wholesale Sales]
and especially for the following :
2013-06-19 16:40 GMT | [CAD - Bank of Canada Governor Speaks]
MetaTrader Trading Platform Screenshots
MetaQuotes Software Corp., MetaTrader 5, Demo
floating inside the cloud

This is interesting situation concerning patterns :
- MN1 timeframe : all developing/forming patterns are showing uptrend
- W1 timeframe : forming patterns for downtrend
- All other timeframes starting from D1 till M30 : for uptrend
Example with MN1 uptrend patterns (forming patterns):

MetaTrader Trading Platform Screenshots
MetaQuotes Software Corp., MetaTrader 5, Demo
MN1 retrecement

This is interesting situation concerning patterns :
- MN1 timeframe : all developing/forming patterns are showing uptrend
- W1 timeframe : forming patterns for downtrend
- All other timeframes starting from D1 till M30 : for uptrend
Example with W1 patterns :
MetaTrader Trading Platform Screenshots
MetaQuotes Software Corp., MetaTrader 5, Demo
w1 retrecement


- MN1 timeframe : all developing/forming patterns are showing uptrend
- W1 timeframe : forming patterns for downtrend
- All other timeframes starting from D1 till M30 : for uptrend
And this is other timeframes - for uptrend (forming patterns)
MetaTrader Trading Platform Screenshots
MetaQuotes Software Corp., MetaTrader 5, Demo
h4 developing pattern retrecement uptrend

MetaTrader Trading Platform Screenshots
MetaQuotes Software Corp., MetaTrader 5, Demo
h8 forming uptrend retrecement

- MN1 timeframe : all developing/forming patterns are showing uptrend
- W1 timeframe : forming patterns for downtrend
- All other timeframes starting from D1 till M30 : for uptrend
And this is other timeframes - for uptrend (forming patterns)
Uptrend, means - bear market rally (correction) :
MetaTrader Trading Platform Screenshots
MetaQuotes Software Corp., MetaTrader 5, Demo
usdcad d1 uptrend

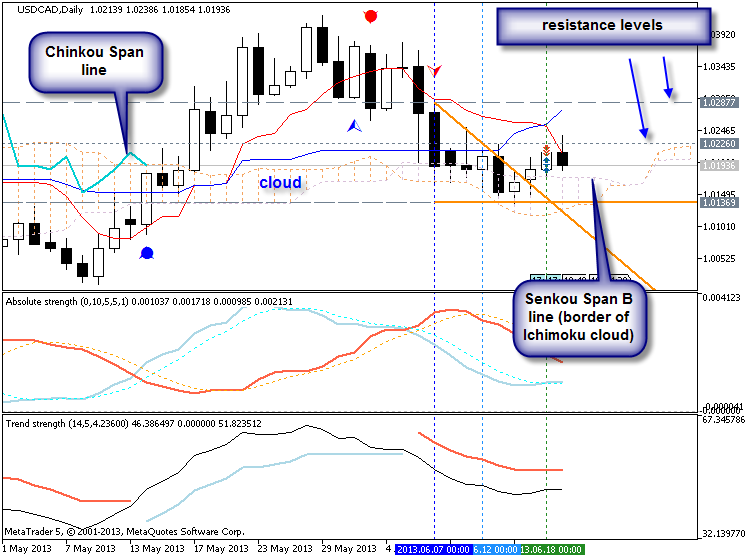
By the way, the price broke resistance level (Sinkau Span B line) wyhich is the border of Ichimoku cloud and the border between primary bullish and primary bearish. So, it was a reversal on close bar (from bearish to bullish). But ... all W1 forming patterns are showing downtrend ... I think - the price may come back to the cloud soon.
And possible breakout is started on open H4 bar ... do you see blue line on the left some of the chart? this line is crossing historical price on open bar (the name of this line is Chinkou Span). This kind of crossing (if on close bar) is the most strongest signal of Ichimoku indicators. We can see here:
MetaTrader Trading Platform Screenshots
MetaQuotes Software Corp., MetaTrader 5, Demo
usdcad h4 possible breakout

I just opened buy trade :
MetaTrader Trading Platform Screenshots
MetaQuotes Software Corp., MetaTrader 5, Demo
temp_file_screenshot_18924.png

This trade was closed with 10 pips in profit ... small but effective :) Why 10 pips only? because I opened the trade on open bar - this Chinkou Span/historical price is crossing on open bar only and it is mostly related to scalping for example (because the trades on open bar).
MetaTrader Trading Platform Screenshots
MetaQuotes Software Corp., MetaTrader 5, Demo
temp_file_screenshot_24471.png

This trade was closed with 10 pips in profit ... small but effective :) Why 10 pips only? because I opened the trade on open bar - this Chinkou Span/historical price is crossing on open bar only and it is mostly related to scalping for example (because the trades on open bar).
This is the statement for today. I placed stop loss and take profit near support / resistance lines :
This is interesting situation for now for D1 timeframe - daily bar was opened above Sinkou Span B line (we know that this line is the border of the cloud and the border berween primary bullish and primary bearish) - and it is indicating the bullish; but Ichimoku cloud is thin and Chinkou Span line is going to cross historical price from above ti below - and it is indicating good breakdown (good for sell trades):
Anyway, this breakdown was already started on H4 timeframe:

- Free trading apps
- Over 8,000 signals for copying
- Economic news for exploring financial markets
You agree to website policy and terms of use
The price was on correction after primary bullish trying to break Senkou Span B line int he beginning of the week. Finally - the price broke this level and came to ranging/flat market condition by the end of the week. USDCAD price is located inside Ichimoku cloud for now by close bar.
Ichimoku cloud is very thin one, and USDCAD may continue bullish trend on this coming week. But if the price will break 1.0147 support level and 1.0117 level from above to below so it will be fully reversal from bullish to bearish. If price will "come back" to bullish by breaking 1.0177 and finally 1.0287 resistance lines so we may see good uptrend for this coming week.
UPCOMING EVENTS (high/medium impacted news events which may be affected on USDCAD price movement for the next week)
2013-06-17 12:30 GMT | [CAD -International Security Transactions]
2013-06-19 12:30 GMT | [CAD - Wholesale Sales]
2013-06-19 16:40 GMT | [CAD - Bank of Canada Governor Speaks]
2013-06-21 12:30 GMT | [CAD - Core CPI]
2013-06-21 12:30 GMT | [CAD - Core Retail Sales]
SUMMARY : correction
TREND : ranging
Intraday Chart