Indicators: Fractal_Level_Xrust
Forum on trading, automated trading systems and testing trading strategies
newdigital, 2013.12.16 11:23
The fractals are technical indicators, part of the Bill Williams’ indicators. Unlike any other indicators, this one is not a line or histogram bars; it is just a simple arrow on top of or below the bars of the price chart. These fractals are formed when five consecutive bars align in a strict manner. There are two types of fractals:
Bearish fractals: this fractal forms over a bar in the price chart, only if the high of this bar is higher than the high of the previous two and next two bars. In real-life trading this fractal indicates a possible bearish movement.
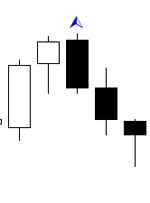
Bullish fractals: this fractal forms below a bar in the price chart, if the low of this bar is lower than the low of the previous two and next two bars. When you see this fractal, you should expect a bullish movement.
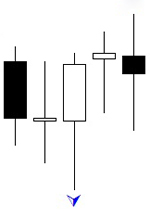
It is important to mention that the Bill Williams’ fractals are illustrated a bit late on the chart, because you need the fifth bar to close, in order to determine the highest high or lowest low. The fractals are trading signals, but they are far too insufficient to count on them alone: the buy fractal indicates a possible buy order and vice versa.
Use in Forex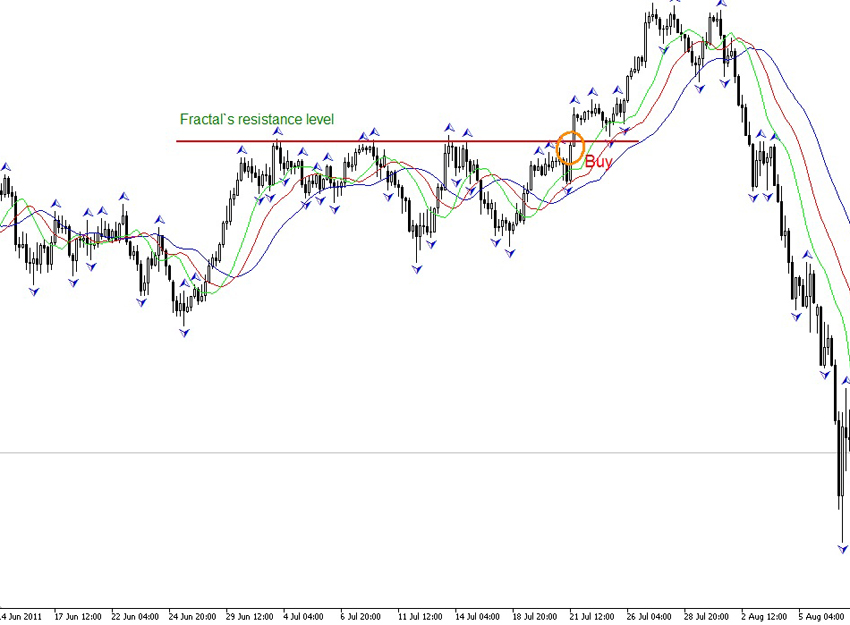
The fractals point out the strong levels. You can easily draw a line to connect multiple fractals to form either a resistance or a support line. These levels work exactly the same as the trend lines. If you take a look at the image, you will see the resistance line and the buy signal. We get this signal, because the price breaks the strong resistance level. However, if you take a close look at the chart before this moment, you will see a couple of sell signals. This clearly points out how inconclusive are the fractals alone.
If you have paid attention on the Trend Lines page, you already know that some traders use the fractals to build their trend line. We really like this strategy, but it is not something revolutionary.
Bill Williams’ fractals and Alligator indicator. These two indicators share great synergy and we will take a quick glance in the image. It is the same as the previous, but we have added the Alligator and this changes the picture quite a lot. Take a look at the buy signal; do you see now why we have not opened a sell order before the buy signal? The price moved above the Alligator and we needed to see a breach of the indicator’s levels and a couple of sell fractals, but did not see that. Instead, the price kept on moving above the Alligator and it even broke the resistance level, which gave us a clear idea of the future movement – buy and take profit.
- Free trading apps
- Over 8,000 signals for copying
- Economic news for exploring financial markets
You agree to website policy and terms of use
Fractal_Level_Xrust:
The indicator draws horizontal lines on the level of last fractals up and down.
Fig.1 The Fractal_Level_Xrust indicator
Author: Nikolay Kositsin