working out angle of ema
SanMiguel
Before fully discussing your request to calc the angle between two MAs, consider this:
I have devoted considerable time in developing a means for calculating angles. First, let me say this --- the 45 degree angle you see on your chart today will not be a 45 degree angle on your chart a few days from now. The reason is all computer generated charts use variable scaling of the vertical scale where the price scale is located. They do this so the data takes up the entire screen. Thus, let's say for example that mathmatically, 1 PIP/Bar = 45 degrees. Sometimes that may visually look like a 45 degree angle on your screen, and sometimes it may visually look like a 60 degree angle --- it all depends on the pricing scale for the chart on your screen at that given moment. Now having said that, as you can now see, it is a complicated topic. So what really constitutes a 45 degree angle? Well you're going to have to pick a number (ie a rate of change per bar), and of course in doing so you do not want to be overly arbitrary. Here's what I did:
1) Downloaded 9 years of M15 data for EURUSD and opened the file in Excel - that's a quarter-million bars worth of data.
2) Calc'd a 100SMA, and manipulated the data to find how many trends exceeded 100 bars (ie 25 hrs)
3) Calc'd the average rate of change for the middle third of the trend (the part that tends to be the straightest)
4) Sorted those trends exceeding 100+ bars (approximately 1000 trends) by the newly calc'd rate of change for the middle-third, and decided to use the 500th rate of change (ie the one midway thru the sorted data) as the rate of change I would use for 45 degrees. Thus, for the M15 chart, I use 0.742 PIPs per Bar as the standard for a 45 degree angle.
Thus for example, if the current rate of change for moving average is 0.876 PIPs per bar, then the angle is:
Arctan(0.876/0.742)=49.7 degrees
An additional cautionary note: In periods of high volatility such as we have experienced in the last 6-9 months, you will get a lot of big angles, if you go to a period low volatility say 2006, the angles will not be as large. Therefore, volatility has a large impact on the angles that get calculated. So what works this year if you set some minimum threshold angle in your EA may not work next year.
Cheers
The slope is the hypotenuse?
3.14 is pi?
Now, which angle does this result give because there are 2 angles in a right angles triangle and both will be different:
Angles
I am only going to be comparing 2 hourly candles so the width is always going to be the same in this calculation, therefore the highs and lows of these 2 candles will give a consistent comparison angle.
I guess strictly this isn't really the moving average. Maybe I could compare the MA-2 at candle 1 and the MA at candle 2 and get a comparison?
If you must know the angle, you always have it, by a form of tangent ratio
You know the amount of movement in a price or an MA and the number of bars, so you have opposite/adjacent
-BB-
The slope is the hypotenuse?
3.14 is pi?
Before getting bogged down in trig, I'd think carefully about what FXTrader2008 is saying. Angles on charts are arbitrary. They vary not only based on the scaling which MT4 automatically selects for a chart, but also on things like your monitor aspect ratio - or anything else which affects the height of the chart (while leaving the width the same, or not changing it proportionally). For example, hiding the MT4 terminal pane will change all the "angles" on a chart. So will switching between a traditional monitor and a wide-screen one. Not only is the angle you see know not the same as the angle you will see next week - as FXTrader2008 is saying - but the angle you see now is not necessarily the same as the angle someone else will see now, if they have different computer settings.
SanMiguel,
As I indicated in my earlier post, calculating the angle of the MA lines is an interesting topic for me. Here's some more info I would like to share with you and others in this thread.
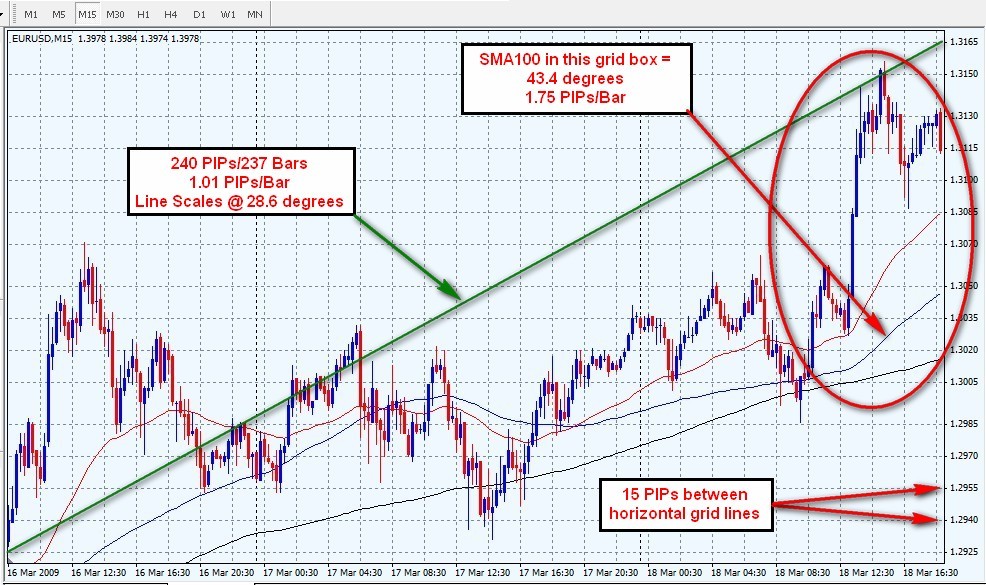
To illustrate how much the angle can vary (even for the same location but is displayed differently just 24 hours later) I selected the M15 chart for 18 Mar 2009.
In the first chart, the SMA100 angle for the grid box shown inside the red oval is 43.4 degrees. However, in the second chart, the SMA angle at the same location just 24 hours later is only 13.1 degrees.
I agree that phy's formula will calc an angle, however, that angle is also arbitrary because his formula subtly assumes that 1 PIP/Bar (a 1:1 ratio) is 45 degrees. Thus, phy's formula would have calculated the angle mentioned in the previous paragraph at 60.3 degrees in the first case and 56.3 degrees in the second case, yet on the monitor (at least on my monitor with my settings) it shows an angle of 43.4 degees initially and then 24 hours later the angle at the same location appears on the monitor to be only 13.1 degrees. Please note, I'm not suggesting phy's formula is wrong I'm justing saying that regardless what method you use to calc the angle, it will almost never match the angle as it appears on your computer monitor.
First Chart
Second Chart

After reading the entries here I am wondering if there is a way to calculate the absolute angle (the actual Line in line charts in my case) and use it in further calculations regardless of the scaling of the chart, the monitor aspect ratio etc?
- Free trading apps
- Over 8,000 signals for copying
- Economic news for exploring financial markets
You agree to website policy and terms of use
Is there a way to work out the angle of an ema between 2 points.
So, we have 2 candles, an EMA figure for hour 1, and an EMA figure for hour 2.
We can then work out the hypotenuse and the angle?