Expert Advisors: ElliottWaveMaker 3.0
Not working with me. Its says something in russian about EWM.TXT when I try to attach to chart.
Did I do something wrong??? its all in russian so I don't even know what to edit.
Not working with me. Its says something in russian about EWM.TXT when I try to attach to chart.
Did I do something wrong??? its all in russian so I don't even know what to edit.
1. Did you placed all the files on the right place ? EWM.txt must be placed MQL5/files.
2. What is you system (OS) and where is installed your platform ?
hello there i am using window 8 (OS) and i have the same problem with EWM.txt, can you tell me where i have to add this file?
Expert Advisors: ElliottWaveMaker 3.0
angevoyageur, 2013.06.20 20:22
1. Did you placed all the files on the right place ? EWM.txt must be placed MQL5/files.
2. What is you system (OS) and where is installed your platform ?
hello there i am using window 8 (OS) and i have the same problem with EWM.txt, can you tell me where i have to add this file?
Did you try . . . MQL5/files/ ?
My reply isn't enough clear ?
This is very simplified description about : Elliott Wave
======
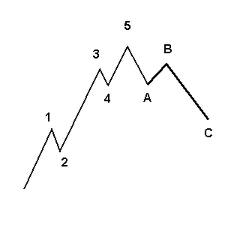
Elliott Wave theory states that prices move in waves. These waves occur in a repeating pattern of a (1) move up, (2) then a partial retracement down, (3) another move up, (4) a retracement, (5) then finally a last move up. Then, there is a (A) full retracement, followed by a (B) partial retracement upward, then (C) a full move downward. This repeats on a macro and micro time frame. A visual illustration of the basic pattern of the Elliott Wave is given below. A real life example of Elliott Wave in action is given further down:
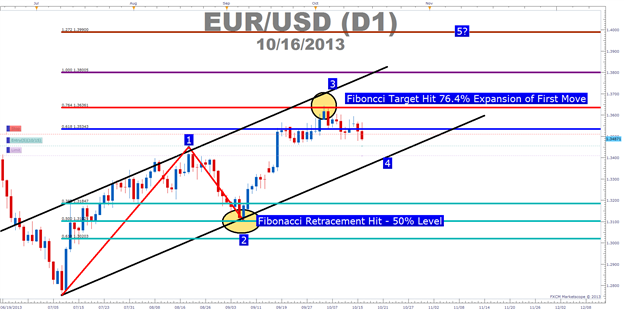
Elliott Wave is based on crowd psychology of booms and busts, rallies and retracements. Traders often use fibonacci numbers (see: Fibonacci) to anticipate where a retracement is likely to end and thus the place where they should place their trade. The chart below illustrates the Elliott Wave pattern applied to crowd psychology (i.e. S&P 500) and Fibonacci Retracements:
In the example above of the S&P 500 ETF, if the Elliott Wave theorist recognizes that he/she just completed a the leg from (2) to (3) and the market is beginning to retrace, the trader might put a buy order at the 38% Fibonacci retracement. In the example above, that trade would have failed and the trader would have been stopped out of their long position. The trader then might consider putting an order in at the 50% retracement. In the example above, that would have been an extremely profitable trade, making up for the previous loss and more.
Next, realizing that the latest trend was the (4) to (5) upmove, the Elliot Wave theorist would next expect a downward move to (A). This retracement is larger than the previous (1) to (2) retracement and (3) to (4) retracement. A reasonable guess as to where the retracement (5) to (A) will end is the 0.618, the golden fibonacci ratio.
Selecting the 61% retracement would have proved profitable for a little while, assuming the trader didn't have extremely tight stop losses in place, but the retracement turned out to be a head fake. Subsequently, the next often used Fibonacci retracement is 100%. This trade would have been very profitable, given the S&P 500 retraced almost perfectly at 100% of the move from (4) to (5).
A likely profit target to exit at least part of the trade initiated at point (A) is the 38% Fibonacci level. This also happened to be the turning point for the next leg down from (B) to (C).
How to Understand the Three Building Blocks for Trading Elliott Wave
Talking Points
- How To Understand the Basic Pattern
- How To Understand Corrections vs. Impulses In Markets
- How To Understand Fibonacci In Relation To Wave Development
-Paul Tudor Jones, Tudor Jones Capital
Elliott Wave is a great trading tool for trading trends. However, it’s not as confusing as a lot people make it out to be when you consider the primary objective of the tool. Elliott Wave is meant to put the current move of the market in context for you, the trader.
Putting the market in context for you is of great help. For starters, if you know a market that has recently been in a strong trend is correcting, you can look for a resumption of the prior trend to enter at a favorable price. Also, you can look to see if the pattern is starting to break down to see if the prior trend has exhausted itself, and look to either take profits or enter a new trade in the direction of the new trend.
Understand the Basic Pattern
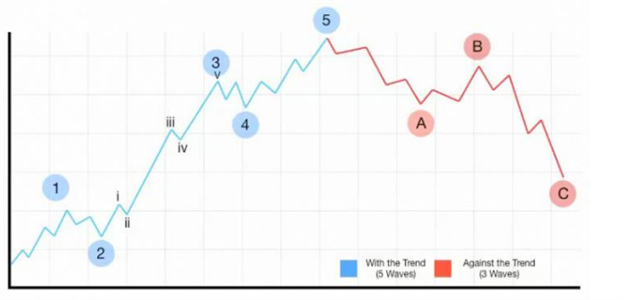
The picture above is a mock-up that shows the progression of markets as seen in Elliott Wave. As you can see, the market is often broken up by strong trends and minor moves against the trend. The with-trend moves are known as impulse or motive waves and the counter trend moves are known as correction.
Another key aspect of Elliott Wave is that trends are fractal. Simply put, that means that each impulsive wave can be broken down into 5 smaller waves and each correction can be broken into 3 smaller segments of a counter-trend move. However, it’s often not overly necessary to label every single aspect of the wave.
How to Understand Corrections vs. Impulses in Markets
As illustrated above, the trend or impulse unfolds in 5-waves whereas corrections unfold often in a 3-wave pattern. You’ll often hear Elliott wave fans discussing trading based on 5-s & 3-s and that is because they identify the trend and countertrend moves based on the unfolding of a move in 5 & 3-wave patterns.
Furthermore, in understanding the basic 5-wave impulse or trend, you can be on the lookout for a 3-wave correction or developing correction. The purpose of looking for a correction is that as the trend resumes, you can look for the correction to be losing steam so that you can enter at a good price. What many traders who are unfamiliar with Elliott wave often end up doing is chasing the price or enter on the extension of the trend right before the correction begins. This causes them to get stopped out because they did not understand the context of the market and current trend when they entered the trade.
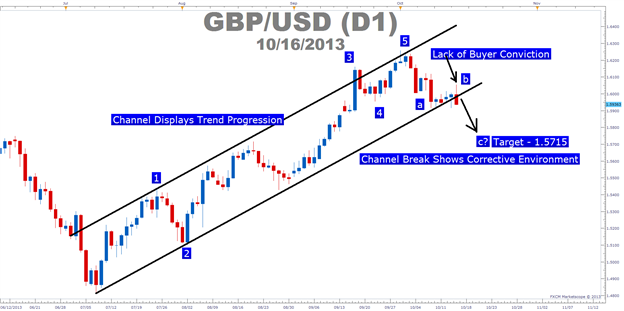
When looking at the 5-wave pattern and 3-wave correction to get context, you can see how the breaking down of GBPUSD has us looking for a correction to continue. Therefore, I’m taking the context as provided by Elliott Wave to get a better feel for GBPUSD. Once this corrective move to the downside completes, then I can look for a buy on a resumption of the overall trend to higher prices.
If you’re not trading GBPUSD, you can take a look at the chart you’re trading and see if you can identify any 5-wave or 3-wave structures. That will help you grab a context of the current market so that you can look for the maturity of the current trend or ideally the exhaustion of the correction. After you’ve identified a current market as ready to resume the trend, you can then look to Fibonacci numbers in order to see where the market is likely go to go as according to Elliott Wave.
How to Understand Fibonacci In Relation To Wave Development
“When R.N. Elliott wrote Nature’s Law, he explained that the Fibonacci sequence provides the mathematical basis of the Wave Principle”
-Elliott Wave Principle, Frost & Prechter pg. 91
Once you’ve been able to get context for the current trend, you can then look to Fibonacci numbers in order to find price objectives within Elliott Wave. In other words, the reason why Elliott Wave traders often utilize Elliott Wave is because you can have definitive levels as to where the correction may end with Fibonacci Retracements. Furthermore, you can have price objectives by utilizing the Fibonacci Expansion tool.
One key thing to note when utilizing Fibonacci retracements within Elliott Wave is that there are levels to watch out for but rarely a level that the market must hit. Therefore, you want to focus on price action near levels like the 61.8% on a wave 2 and a 38.2% on wave 4. If you see a lack of conviction past these levels then you can look to a resumption of the overall trend off of these levels.
In terms of price objectives, you can use the Fibonacci expansion tool. The expansion tool takes three points on the chart to project the exhaustion of the next impulse. The most-commonly used targets are the 61.8%, 100% & 161.8% expansion. This simply means that this impulse is either 61.8%, 100% or 161.8% of the prior wave and simply shows you the progression and strength of the current trend.
Closing thoughts
Elliott can be a headache if you worry about labeling every wave and every correction. Instead, I’d recommend focusing on the big picture. In other words, are we in an impulse or a correction? More importantly, if we’re in a correction that’s about to be exhausted, where can we enter on the resumption of the trend?
Elliott Wave (based on thetechnicaltraders article)
Every investor has seen the odd phenomena of stocks going down when there is good news about the stock or conversely stocks going up when there is bad news about the stock. Is there a system that can be used to help analyze these trends and to be able to then predict stock trends? The answer is yes, and one possibility is Elliot Wave Theory.
Elliot Wave Theory examines how groups of individuals react en masses to things in their environment and the psychological reasons for such reactions. Elliot Wave Theory then groups those reactions into predictable patterns or ‘waves. Once you have identified a particular trigger, you can then predict the coming waves and how groups will behave in accordance to those waves.
Elliot Waves: mini waves make up bigger waves
The key component of Elliot Wave Theory are the Elliot Waves themselves. Several mini Elliot Waves will make up one bigger wave. The bigger wave is known as a fractal. Fractals can then be grouped together to create an even larger wave showing a complete trend based one trigger.
Elliot Wave Predictions
The stock market is an excellent vehicle to use Elliot Wave Theory to analyze potential market trends. Once a potential trigger has been identified, the potential movement of the stock can be predicted by the applying the Elliot Wave principles. Opportunities for solid Elliot Wave Predictions exist whether the stock is moving in an upwards or downwards trend as Elliot Wave Theory accounts for upwards and downwards movement.
Elliot Wave Gold
Elliot Wave Theory can be applied to anything that is traded, including gold. Elliot Wave Gold systems can provide an opportunity for excellent growth. The key of course is being able to identify a trigger, understand that triggers implications, and then predict how groups of investors will react. That’s where solid, proven Elliot Wave Theory application can give you an edge in your invested strategies.
- Free trading apps
- Over 8,000 signals for copying
- Economic news for exploring financial markets
You agree to website policy and terms of use
ElliottWaveMaker 3.0:
ElliottWaveMaker 3.0 is Tool for Semi-Automatic Analysis of Elliott Waves and Andrew's Pitchforks, a logical extension of version 2.0 known as AutoElliottWaveMaker. In version 3.0 minor errors are corrected, the ability to draw Andrew's Pitchforks and a few additional functions are added.
Fig. 1. Andrew's Pitchforks drawn using ElliottWaveMaker 3.0
Author: Roman Martynyuk