Indicators: FX_Sniper_Ergodic_CCI
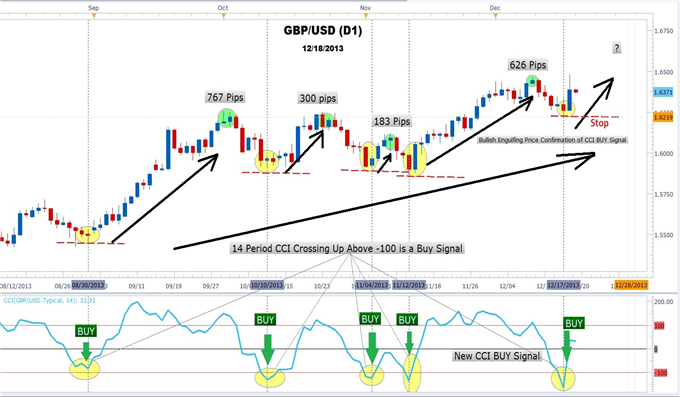
- Since the July lows, GBPUSD has rallied 1671 pips in a strong uptrend.
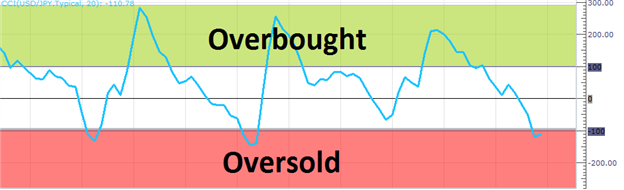
- The Commodity Channel Index (CCI) measures deviations from the moving average while showing overbought and oversold conditions
- When CCI crosses up above the -100 line, a buy signal is generated
Don’t get thrown off by the lengthy name “Commodity Channel Index” as it is not a new 24-hour cable broadcast devoted to pork bellies and soybeans; though you could use it to trade either of these. CCI is a popular indicator used by Forex traders to identify oversold and over bought conditions much in the same way that RSI or Stochastics is used. But instead of 30 and 70 representing oversold and overbought areas, CCI uses -100 and +100. Though Donald Lambert created CCI back in 1980 to identify cyclical turns in commodities it is very effective with currencies. By measuring the current price relative to the average price of a set period like 14, CCI is low during time prices are below their average and high when prices are above their average. This gives us the oversold and overbought regions.
Why is this important you may ask? Well, it is simple. When we have a strong uptrend, the best place to buy is at price point where traders are no longer selling or selling pressure begins to subside. This is called being “oversold”. How do we know when something is oversold? This is a great question too! Forex traders have several tools and methods at their disposal to show them when prices have fallen too far too fast and when bargain hunters may step in sending prices higher. Candlestick pattern, oscillators and support/resistance levels are the primary tools. With CCI, Forex traders look to buy when CCI crosses above -100.
Similar to real estate investing, without the headache and a lot more fun, Forex traders want to buy the “worse house in the best neighborhood at the lowest price.” In our analogy, the best neighborhood is a strong trend; the “worse house” is the entry zone for our trade. Like the real estate investor, we look for the value of our holdings to increase over time. Since we have bought at a relatively low price, our risk is small relative to the potential gain. Unlike real estate fixer-uppers, Forex traders can forget remodeling as time and trend work to increase the value of the position
Trading Setup
The current trading setup below shows a GBPUSD daily chart uptrend from August 2013. The chart depicts four successful by signals given by CCI as it crossed down below the -100 line and turned up. Forex trend traders would filter out the sell signals generated when CCI crossed down below the +100 line as more pips are gained when trading with the trend than against it. In an uptrend, traders Forex Traders will take buy signals using CCI and use CCI sell signals to take profits. Waiting for CCI to turn above -100 and looking for price to confirm the move, traders will enter the market long and then place a protective stop order about 4-10 pips below the last swing low.
The Trading Plan
Currently, GBPUSD has just bounce from the 1.6220 area and CCI has generated a buy signal when it crossed above the -100 line. A stop could be placed just below that swing low for a target of 1.6671. Remember to always use stops and to only risk no more than 2% of your account equity on any trade. If the stop is hit, then we look for another trade! CCI is simple way to visually identify potential entries.
- Free trading apps
- Over 8,000 signals for copying
- Economic news for exploring financial markets
You agree to website policy and terms of use
FX_Sniper_Ergodic_CCI:
The ergodic CCI
Fig.1 The FX_Sniper_Ergodic_CCI indicator
Author: Nikolay Kositsin