Indicators: Renko_v1
How to Use Renko Bricks and Moving Averages to Find Trades
Talking Points
- Renko bars help filter the noise
- Renko bars reveal clearer entries and exits
- Moving Averages can be used with Renko bars with some minor setting changes to pinpoint entries
Seeing the trend without Forex market noise is the goal of every trader. Too many times, traders get head-faked by the twists and turns of price action.
In addition moving averages can be used to signal entries and exits as well. A couple of settings have to be changed in order to get the moving averages which are usually tied to time, to work with a chart system that is based on price.
To add a 13-period exponential moving average to the Renko chart, choose EMA from the Add Indicator menu then change “Number of periods” to 13.
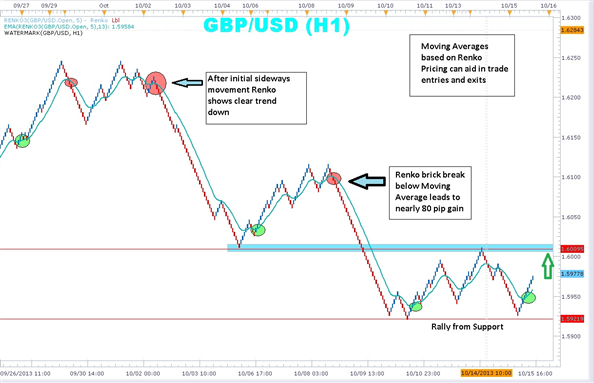
Notice the chart above which displays both Renko bars and a 13-period exponential moving average. A simple system can be built around the Renko bars and the moving average. When Renko price bars cross below the moving average and turns red, traders can enter short and stay with the trend until the Renko bars cross back above the moving average.
An initial stop could be placed just above the last blue Renko brick. Keep in mind that in the above example, each brick is equal to five pips. In the above example, the red circles mark where the Renko bars crossed below the moving average. A trader can see that a number of pips could have been gathered as the bars stayed below the moving average.
On the other hand, when the Renko bars change color and cross above the moving average, traders can enter long placing stop just below the last red Renko brick. The above chart shows in the green circles, points were the Renko price bars moved above the moving average generating a clear buy signal.
Renko charts, without the dimension of time, may take a little getting a little used to. But once you get the hang of them, you may find it difficult to go back to the candles. Adding a moving average gives excellent signals for entry and exit. Marrying them up with other indicators can magnify the benefits of trading without noise and scary wicks!
Forum on trading, automated trading systems and testing trading strategies
Expert Advisors: Renko Line Break vs RSI EA
newdigital, 2014.03.28 07:39
The 3 Step EMA and Renko Strategy for Trading Trends (based on dailyfx article)- Many Forex traders use weighted moving averages, called EMA’s, to trade currency pairs that are trending.
- Determine the direction of the dominant trend direction with a 200 period EMA.
- Use price crossing a 13 period MA as both an entry trigger and manual trailing stop
Developed in the 18th century in Japan to trade rice, Renko charting is a trend following technique. It is excellent for filtering out price “noise” so traders can catch a major part a given Forex trend. It was believed that the name “Renko” originated from the Japanese word ‘renga’ meaning ‘brick’.
Similar to Kagi and Point and Figure charting, Renko ignores the element of time used on candlesticks, bar charts, and line charts. Instead, Renko focuses on sustained price movement of a preset amount of pips.
For example, a trader can set the bricks for as little as 5 pips or as many as 100 or more. A new brick will not be formed until price has moved 100 pips. It could take 24 hours for a new brick to form or it could take just a few hours. However, no bricks will form until the preset limit is achieved.
Find the Trend Direction
Renko charts can incorporate many of the usual technical indicators like stochastics, MACD, and moving averages. Today’s strategy will marry up Forex Renko charts with a 200 Exponential Moving Average (EMA) to find trend direction. Very simply, if price is trading above its 200 EMA, then the trend is up. If price is trading below its 200 EMA, then the trend is down.
This filter will give us a directional bias much like a compass or GPS. We will look to only take long trades when the Renko bricks are trending above the 200 EMA. On the other hand, in a downtrend, if the Renko bricks are trending below the 200 EMA, then the trend down. Forex traders will only look to short the market. One of the biggest mistakes swing traders make is entering trades that go counter to the dominant trend.
When to Get In
After the dominant trend direction is determined, traders can use the simplicity of Renko charts with a single 13 period EMA as a ‘trigger’ to signal an entry in the direction of the major trend. First, wait for at least two green bricks to appear above the 13 EMA. Then enter long on the appearance of the second green brick above the 13 EMA.
Exiting for Profit and for Loss
Once a trader is “triggered” into the trade, a protective stop can be set one-brick size below the 13 EMA. As long as the bricks remain above the 13 EMA, we look to stay with the trend. Just as the 13 EMA can get you in a new trade, the same EMA can be used to stop out a winning trade locking in profits.
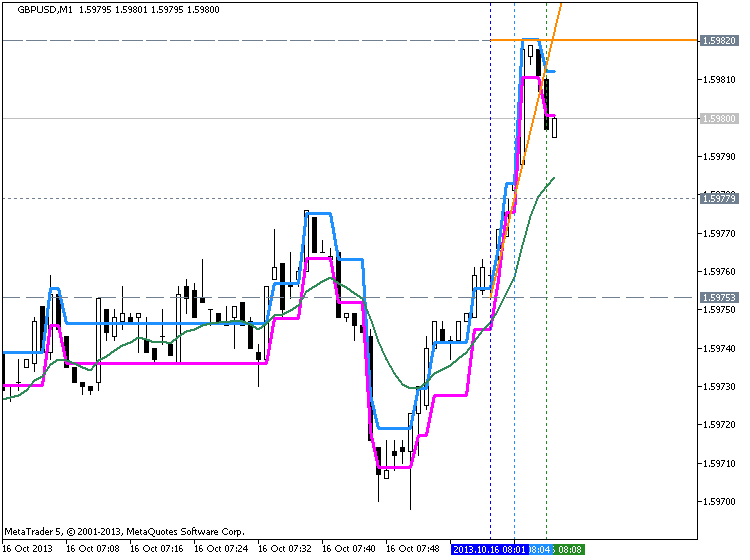
Traders will need to manually move the stop one brick-size below 13 EMA and the current price brick. You can see in the example above how the combination of Renko and the 13 EMA helps traders stay with the trend a longer time.
What's the difference between this one and the one you posted on V2?
- Free trading apps
- Over 8,000 signals for copying
- Economic news for exploring financial markets
You agree to website policy and terms of use
Renko_v1:
The trend indicator which draws the boundaries of the channel
Fig.1 The Renko_v1 indicator
Author: Nikolay Kositsin