 MetaTrader 5
 Experts
 Indicators
 Scripts
 Libraries
 Storage
Join our fan page

Session Sweep Boxes - indicator for MetaTrader 5

- Pine script programming
- CAlgo Programming
- Full Stack Web development
- Views:
- 94
- Published:
-
 You are missing trading opportunities:
- Free trading apps
- Over 8,000 signals for copying
- Economic news for exploring financial markets
Registration Log inYou agree to website policy and terms of use
If you do not have an account, please register -
 Need a robot or indicator based on this code? Order it on Freelance
Go to Freelance
Need a robot or indicator based on this code? Order it on Freelance
Go to Freelance


Session Sweep Boxes draws the Asian, London and New York trading sessions as range boxes on the chart and detects liquidity sweeps of those ranges. A sweep happens when price trades beyond the high or low of a completed session and then closes back inside that level. This pattern often appears when stop orders resting above or below a session range are triggered before price reverses.
A red arrow above a bar marks a sweep of a session high, which is a bearish signal. A blue arrow below a bar marks a sweep of a session low, which is a bullish signal. Signals are confirmed only on closed bars, so they do not repaint. After a session ends, its high and low are extended as dotted lines until they are swept, broken by a close beyond them, or until the same session starts again on the next day.
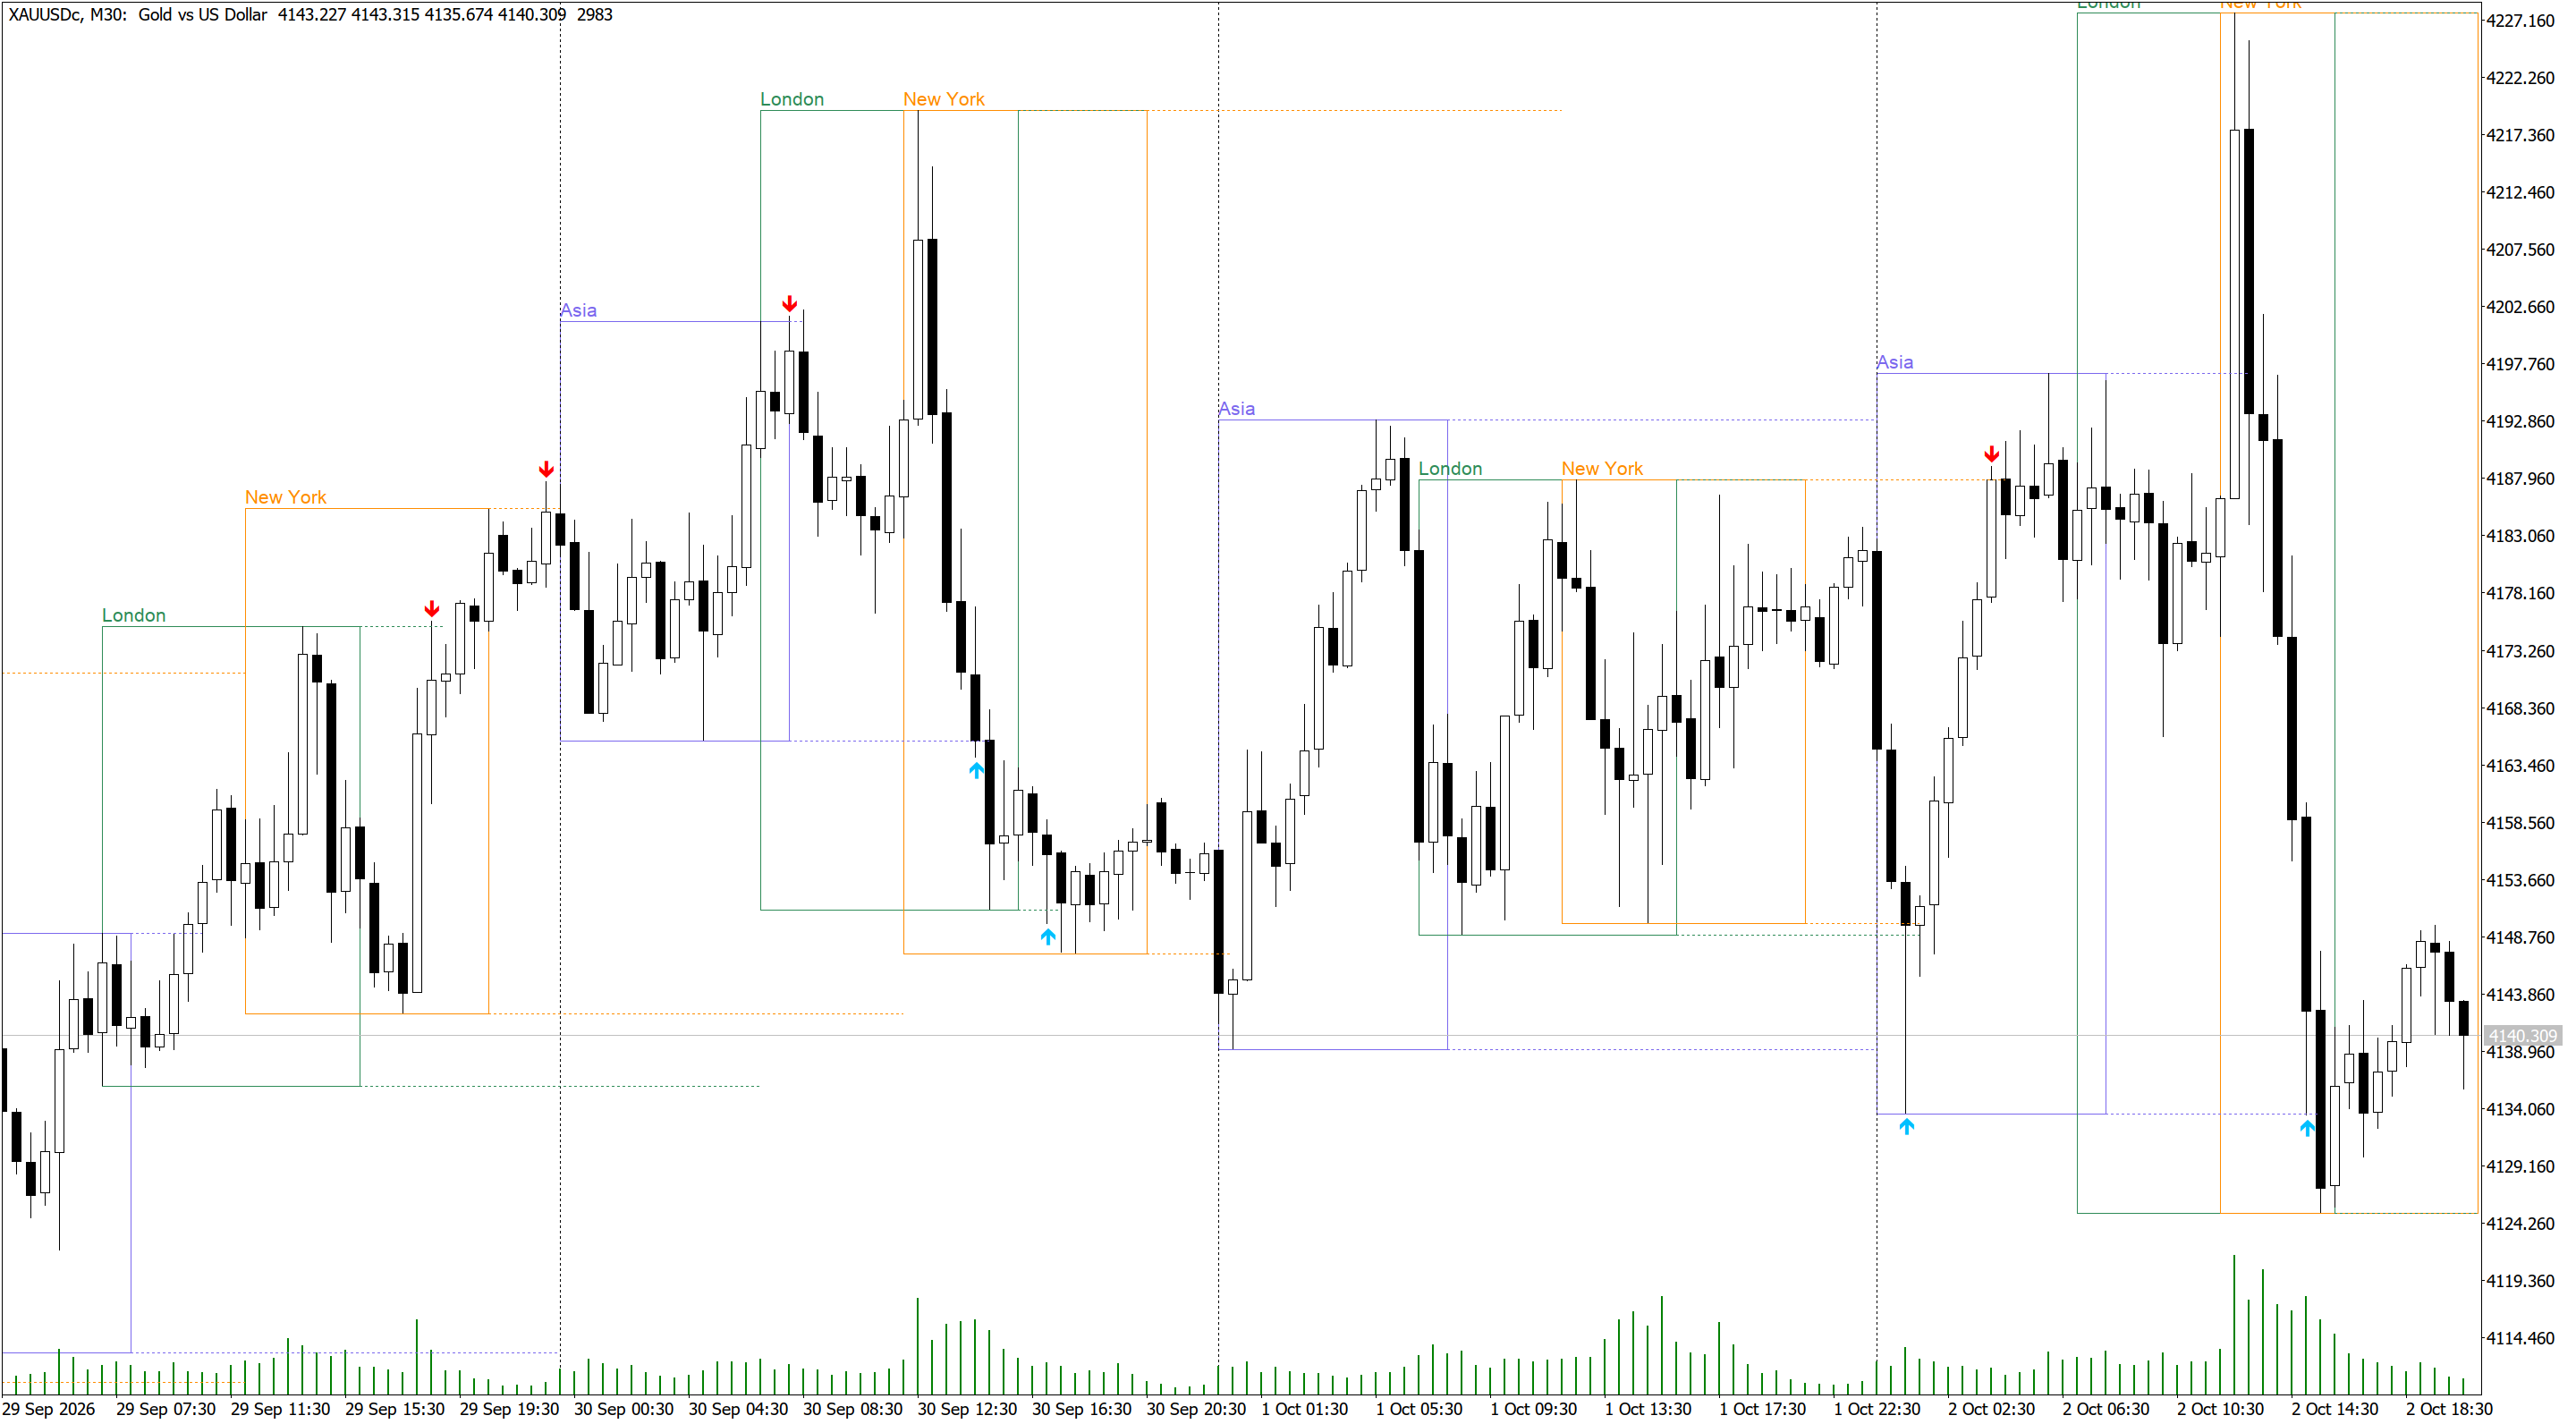
Session times are entered in GMT, so the indicator works with any broker. The server GMT offset can be detected automatically or entered manually. Auto-detection needs a live connection, so in the Strategy Tester the manual offset is used. If the boxes look shifted by one hour, for example after a daylight saving time change, switch to the manual offset and enter your broker's value.

| Input | Description |
|---|---|
| Server GMT offset mode | Auto-detect the broker's GMT offset, or use the manual value below. |
| Manual server GMT offset | Broker server offset from GMT in hours, for example 2 or 3. |
| Days of history to draw | How many days of past sessions are drawn on the chart. |
| Show / start / end / color (per session) | Enable each session, set its start and end time in GMT (HH:MM) and choose its color. Defaults: Asia 00:00-08:00, London 07:00-16:00, New York 12:00-21:00. |
| Fill session boxes | Draws filled boxes instead of outlines. |
| Show session name labels | Shows the session name above each box. |
| Extend completed session high/low lines | Draws dotted lines from each completed session's high and low. |
| Arrow distance from bar | Distance between the arrow and the bar. |
| Mark only the first sweep of each level | If enabled, a level stops after its first sweep. If disabled, every sweep of the level is marked. |
| Cancel a level after a bar closes beyond it | A close beyond the level is treated as a breakout, and the level is no longer watched for sweeps. |
| Pop-up / push / sound alerts | Alerts when a sweep is confirmed on a newly closed bar. |
The indicator has two buffers that Expert Advisors can read with iCustom: buffer 0 for high sweeps and buffer 1 for low sweeps. Any value other than EMPTY_VALUE means a sweep occurred on that bar. The indicator works on H1 and lower timeframes, and M5 to M30 give the clearest picture of the session ranges.
 AN Guard Lite - Trade Journal and Report for any EA
Writes a CSV journal of every trade with the exit reason, and a report that shows how far each trade ran, in R. It never trades.
ICT Killzones and Session Pivots
ICT killzones for MetaTrader 5: Asia, London and New York sessions drawn in New York time with automatic daylight-saving conversion, session highs and lows carried forward until price takes them, previous day, week and month levels, opening prices and time markers. One file, no DLL.
Volatility Regime Shader
Shades the chart background by volatility regime (Compression, Normal, Expansion) based on the percentile rank of the current ATR. Shows the current regime on the chart, alerts on regime changes and exposes buffers for Expert Advisors.
ATR Candle Strength
Shades the chart background by volatility regime (Compression, Normal, Expansion) based on the percentile rank of the current ATR. Shows the current regime on the chart, alerts on regime changes and exposes buffers for Expert Advisors.