 MetaTrader 5
 Experts
 Indicators
 Scripts
 Libraries
 Storage
Join our fan page

Hurst Exponent Regime Switch Indicator - indicator for MetaTrader 5

- Views:
- 1603
- Rating:
- Published:
- Updated:
-
 You are missing trading opportunities:
- Free trading apps
- Over 8,000 signals for copying
- Economic news for exploring financial markets
Registration Log inYou agree to website policy and terms of use
If you do not have an account, please register -
 Need a robot or indicator based on this code? Order it on Freelance
Go to Freelance
Need a robot or indicator based on this code? Order it on Freelance
Go to Freelance
Hurst Exponent Regime Switch Indicator
Short Description: Estimates the rolling Hurst exponent of price via rescaled-range (R/S) analysis and plots it as a color-coded oscillator that flags whether the market is currently trending, mean-reverting, or moving like a random walk.
Author: ADEDAYO GBADEBO
The idea behind it
Most oscillators assume price behaves the same way all the time and simply measure how far it has moved. The Hurst exponent takes a different angle: it measures the statistical character of the price path itself — whether recent moves tend to persist in the same direction (trending), cancel each other out (mean-reverting), or show no serial structure at all (random walk). This indicator estimates that exponent on a rolling window using classic rescaled-range (R/S) analysis: for each bar, the lookback window of price is split into sub-segments of several different sizes, the range of the cumulative mean-adjusted deviation is divided by the standard deviation for every segment, and the resulting R/S values are averaged per segment size. A least-squares regression of log(R/S) against log(segment size) produces a slope between 0 and 1 — that slope is the Hurst exponent, H. A value near 0.5 corresponds to a random walk, values pushing toward 1.0 indicate a persistent/trending regime, and values pulling toward 0.0 indicate an anti-persistent/mean-reverting regime.
Because the calculation needs a reasonably long price history to be statistically meaningful, this indicator is best suited to swing and position analysis rather than scalping. It works on any symbol and timeframe, but behaves most reliably on liquid instruments like EURUSD or major indices on the H1 or H4 chart, where the underlying price series has enough bars of clean data for the R/S sub-sampling to converge. A raw value is smoothed with a short EMA before being plotted, which keeps the regime line from flickering across the trend and reversion thresholds on noisy ticks.
How to interpret it
- Hurst Exponent line — the main color-coded line moving between 0 and 1. It turns one color when it is at or above the upper threshold (trending regime), a neutral shade in between (random walk), and a third color when it is at or below the lower threshold (mean-reverting regime).
- Rescaled-range calculation — under the hood, the lookback window is repeatedly sub-divided into chunks of increasing size; the average R/S statistic per chunk size is regressed in log-log space, and the regression slope is clamped to [0,1] and reported as the exponent for that bar.
- Trend Threshold / Reversion Threshold — the two dotted horizontal reference lines. Crossing above the trend threshold signals that recent price action has developed statistically significant persistence; crossing below the reversion threshold signals anti-persistent, choppy behavior that tends to snap back toward a local mean.
- Practical usage — use the trending regime to justify trend-following entries (breakouts, pullback continuations, moving-average crossovers) and treat signals from those same tools with more caution when the exponent sits in the reversion zone, where range-trading or fade strategies around support/resistance tend to perform better instead.
External variables (inputs)
| Input | Default | Purpose |
|---|---|---|
| InpLookback | 200 | Number of bars in the rescaled-range analysis window used to estimate each Hurst value. |
| InpMinChunk | 8 | Smallest sub-segment size used when sub-dividing the lookback window for R/S sampling. |
| InpChunkSteps | 6 | Number of chunk-size doublings tested; more steps give a smoother log-log regression at extra CPU cost. |
| InpSmoothPeriod | 5 | EMA period applied to the raw per-bar Hurst estimate to reduce flicker across the regime thresholds. |
| InpTrendThreshold | 0.55 | Hurst level at or above which the market is classified as trending/persistent. |
| InpReversionThreshold | 0.45 | Hurst level at or below which the market is classified as mean-reverting/anti-persistent. |
| InpAppliedPrice | PRICE_CLOSE | Price source used to build the series that feeds the rescaled-range calculation. |
Recommended use
Add the indicator to its own subwindow beneath the price chart, as shown below, and read it alongside a trend or mean-reversion tool you already trust rather than as a standalone signal generator. When the line is in the upper (trending) band, weight trend-following setups more heavily and give breakouts room to run; when it drops into the lower (reversion) band, favor range-bound tactics and tighten trend-following filters, since directional signals are statistically more likely to be noise in that regime. Because rescaled-range analysis needs a full lookback window of history before it produces a value, allow the chart to load at least InpLookback bars of history, and expect the line to react gradually — this is a regime filter, not a fast trigger.
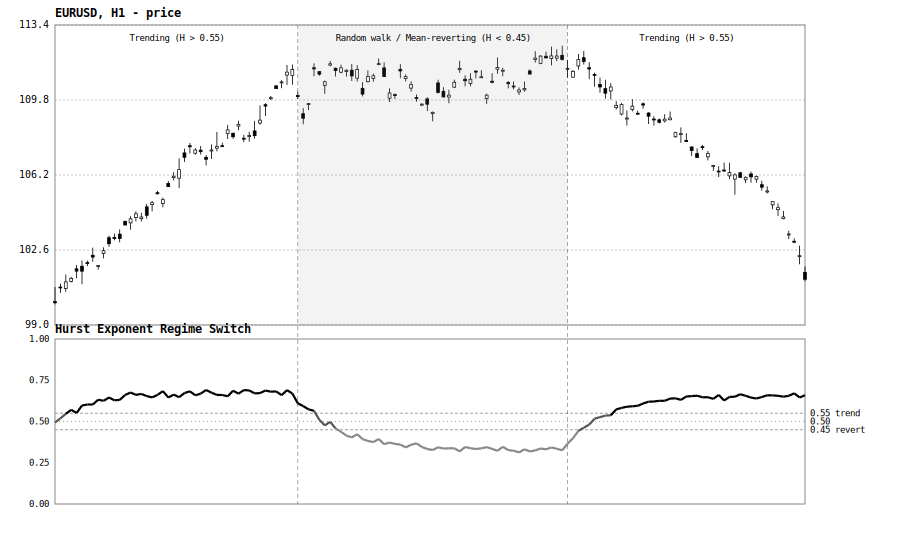
Fig. 1. Price panel (top) moves from a persistent uptrend into a choppy, mean-reverting phase and back into a persistent downtrend; the Hurst Exponent Regime Switch subwindow (bottom) tracks the shift, rising above the 0.55 trend threshold during the directional phases and dropping below the 0.45 reversion threshold during the choppy phase in between.
Multi Timeframe Trend Dashboard Indicator
A compact on-chart panel showing the current symbol's trend across several timeframes at once, each evaluated independently with its own Fast/Slow moving-average cross. No switching charts to check "what's H4 doing" — it's all in one place, color-coded.
Fisher Transform Indicator
A Fisher Transform oscillator built from statistical first principles — normalizing price into a bounded range, then applying a logarithmic transform to produce sharp, well-defined reversal signals instead of the gradual turns typical of conventional oscillators. Internal recursive state is handled through proper calculation buffers for reliable, correct behavior across backtests. From the article series "Making Custom Indicators for Beginners."
Swing Detector by Pullback (Smart Money Concepts)
SMC Pullback marks swing highs and lows using the pullback definition instead of the usual 3-candle pattern. A high is confirmed only when price trades back through the low of the candle that made it — so every marked point is an actual rejection, and highs and lows always alternate. It evaluates closed bars only and never moves a marker once drawn, so it does not repaint. Two buffers expose the confirmed swing prices to an EA via iCustom.
 Basket Protective Close
Closes a basket of positions when its floating loss reaches a limit set as fixed money, a percent of balance, or a percent of equity. Scope filters by symbol or magic numbers, optional profit target, safe non blocking retries.