 MetaTrader 5
 Experts
 Indicateurs
 Scripts
 Bibliothèque
 Stockage
Rejoignez notre page de fans

Hurst Exponent Regime Switch Indicator - indicateur pour MetaTrader 5

- Vues:
- 37
- Note:
- Publié:
-
 Vous manquez des opportunités de trading :
- Applications de trading gratuites
- Plus de 8 000 signaux à copier
- Actualités économiques pour explorer les marchés financiers
Inscription Se connecterVous acceptez la politique du site Web et les conditions d'utilisation
Si vous n'avez pas de compte, veuillez vous inscrire -
 Besoin d'un robot ou d'un indicateur basé sur ce code ? Commandez-le sur Freelance
Aller sur Freelance
Besoin d'un robot ou d'un indicateur basé sur ce code ? Commandez-le sur Freelance
Aller sur Freelance
Indicateur de changement de régime de l'exposant de Hurst
Brève description : Estime l'exposant de Hurst glissant du cours à l'aide de l'analyse de la fourchette redimensionnée (R/S) et le représente sous la forme d'un oscillateur à code couleur qui indique si le marché suit actuellement une tendance, revient à la moyenne ou évolue selon un mouvement aléatoire.
Auteur : ADEDAYO GBADEBO
Le principe
La plupart des oscillateurs partent du principe que le cours se comporte toujours de la même manière et se contentent de mesurer l’amplitude de ses fluctuations. L’exposant de Hurst adopte un angle différent : il mesure la nature statistique de l’évolution du cours elle-même — à savoir si les mouvements récents ont tendance à persister dans la même direction (tendance), à s’annuler mutuellement (retour à la moyenne) ou à ne présenter aucune structure séquentielle (marche aléatoire). Cet indicateur estime cet exposant sur une fenêtre glissante à l’aide de l’analyse classique de la plage redimensionnée (R/S): pour chaque barre, la fenêtre rétrospective du cours est divisée en sous-segments de plusieurs tailles différentes ; l’amplitude de l’écart cumulé ajusté à la moyenne est divisée par l’écart-type de chaque segment, et les valeurs R/S obtenues sont moyennées par taille de segment. Une régression par les moindres carrés de log(R/S) en fonction de log(taille du segment) donne une pente comprise entre 0 et 1 — cette pente correspond à l’exposant de Hurst, H. Une valeur proche de 0,5 correspond à une marche aléatoire, les valeurs tendant vers 1,0 indiquent un régime persistant/tendanciel, et celles tendant vers 0,0 indiquent un régime anti-persistant/de retour à la moyenne.
Comme le calcul nécessite un historique de cours suffisamment long pour être statistiquement significatif, cet indicateur est plus adapté à l’analyse de swing et de position qu’au scalping. Il fonctionne sur n’importe quel symbole et n’importe quelle période, mais se comporte de manière plus fiable sur des instruments liquides comme l’EURUSD ou les principaux indices sur les graphiques H1 ou H4, où la série de cours sous-jacente comporte suffisamment de barres de données propres pour permettre la convergence du sous-échantillonnage R/S. La valeur brute est lissée à l’aide d’une moyenne mobile exponentielle (EMA) à court terme avant d’être tracée, ce qui empêche la ligne de régime de fluctuer entre les seuils de tendance et de réversion en cas de ticks bruités.
Comment l’interpréter
- Ligne de l’exposant de Hurst — la ligne principale, codée par couleur, évoluant entre 0 et 1. Elle prend une couleur lorsqu’elle est égale ou supérieure au seuil supérieur (régime de tendance), une teinte neutre entre les deux (marche aléatoire), et une troisième couleur lorsqu’elle est égale ou inférieure au seuil inférieur (régime de retour à la moyenne).
- Calcul de la plage re-échelonnée — en arrière-plan, la fenêtre de rétrospection est subdivisée de manière répétée en segments de taille croissante ; la statistique R/S moyenne par taille de segment est régressée dans un espace log-log, et la pente de la régression est limitée à [0,1] puis indiquée comme l’exposant de cette barre.
- Seuil de tendance / Seuil de réversion — les deux lignes de référence horizontales en pointillés. Un franchissement au-dessus du seuil de tendance indique que l’évolution récente des cours a développé une persistance statistiquement significative ; un franchissement en dessous du seuil de réversion signale un comportement anti-persistant et irrégulier, qui tend à revenir brusquement vers une moyenne locale.
- Utilisation pratique — utilisez le régime de tendance pour justifier les entrées en suivi de tendance (cassures, poursuite des retracements, croisements de moyennes mobiles) et traitez les signaux provenant de ces mêmes outils avec plus de prudence lorsque l’exposant se situe dans la zone de réversion, où les stratégies de trading dans une fourchette ou de « fade » autour des niveaux de support/résistance ont tendance à donner de meilleurs résultats.
Variables externes (données d’entrée)
| Entrée | Par défaut | Objectif |
|---|---|---|
| InpLookback | 200 | Nombre de barres dans la fenêtre d’analyse de la plage redimensionnée utilisée pour estimer chaque valeur de Hurst. |
| InpMinChunk | 8 | Taille minimale des sous-segments utilisée lors de la subdivision de la fenêtre de rétrospective pour l'échantillonnage R/S. |
| InpChunkSteps | 6 | Nombre de doublages de la taille des blocs testés ; un nombre plus élevé d’étapes permet d’obtenir une régression log-log plus lisse, au prix d’une charge supplémentaire pour le processeur. |
| InpSmoothPeriod | 5 | Période EMA appliquée à l'estimation brute de Hurst par barre afin de réduire les fluctuations aux seuils de régime. |
| InpTrendThreshold | 0,55 | Niveau de Hurst à partir duquel le marché est considéré comme étant en tendance/persistant. |
| InpReversionThreshold | 0,45 | Niveau de Hurst à partir duquel le marché est considéré comme régressif/anti-persistant. |
| InpAppliedPrice | PRICE_CLOSE | Source de cours utilisée pour construire la série qui alimente le calcul de la fourchette redimensionnée. |
Utilisation recommandée
Ajoutez l’indicateur dans sa propre sous-fenêtre sous le graphique des cours, comme illustré ci-dessous, et interprétez-le en parallèle d’un outil de tendance ou de retour à la moyenne auquel vous faites déjà confiance, plutôt que de l’utiliser comme un générateur de signaux autonome. Lorsque la ligne se trouve dans la bande supérieure (tendance), accordez davantage d’importance aux configurations de suivi de tendance et laissez les cassures se développer ; lorsqu’elle descend dans la bande inférieure (retour à la moyenne), privilégiez les stratégies de trading dans une fourchette et resserrez les filtres de suivi de tendance, car les signaux directionnels sont statistiquement plus susceptibles d’être du bruit dans ce régime. L’analyse de la fourchette redimensionnée nécessitant une fenêtre de rétrospective complète avant de produire une valeur, laissez le graphique charger au moins InpLookback barres d’historique et attendez-vous à ce que la ligne réagisse progressivement — il s’agit d’un filtre de régime, et non d’un déclencheur rapide.
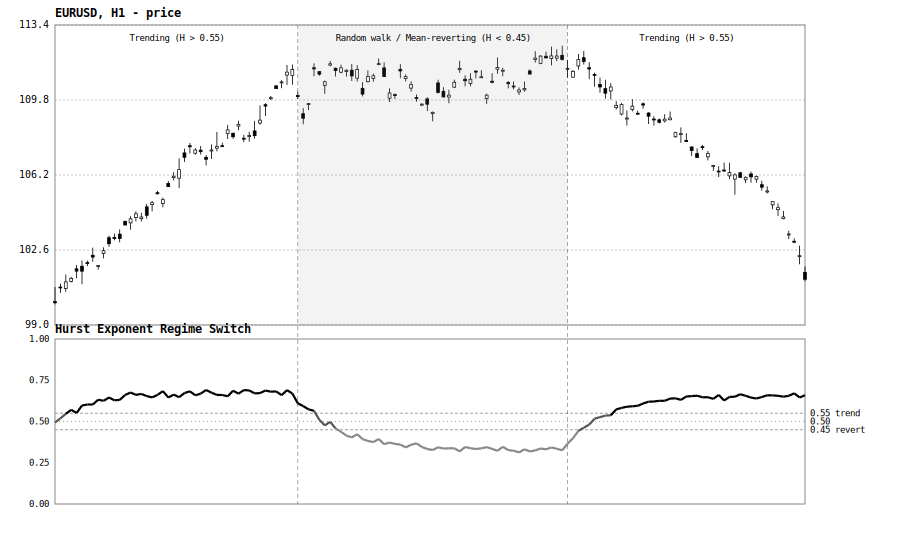
Fig. 1. Le panneau des cours (en haut) passe d’une tendance haussière persistante à une phase instable de retour à la moyenne, puis revient à une tendance baissière persistante ; la sous-fenêtre « Hurst Exponent Regime Switch » (en bas) suit cette évolution, dépassant le seuil de tendance de 0,55 pendant les phases directionnelles et passant sous le seuil de réversion de 0,45 pendant la phase de fluctuations intermédiaires.
Traduit de l’anglais par MetaQuotes Ltd.
Code original : https://www.mql5.com/en/code/76439
Spread Monitor for Scalpers
Spread histogram in a sub-window with current/avg/max/min stats, cost per trade, and threshold alerts for scalpers.
 RiskGuard Lite - Percent-Risk EMA/ATR EA
Educational MT5 EA: closed-bar EMA crossover entries, ATR-based stop loss and take profit, lot size from a fixed percent of equity via OrderCalcProfit, spread filter, magic-number isolation and server return-code checks. A clean template for building risk-controlled EAs. No profit claim.
Multi Timeframe Trend Dashboard Indicator
Un panneau compact intégré au graphique qui affiche simultanément la tendance du symbole actuel sur plusieurs périodes, chacune étant évaluée indépendamment à l'aide de son propre croisement de moyennes mobiles « Fast » et « Slow ». Plus besoin de changer de graphique pour vérifier « ce qui se passe sur H4 » : tout est regroupé au même endroit, avec un code couleur.
AAPL cfd - ORB strategy
Utilisation de la stratégie ORB sur le CFD AAPL