ALFRED MURIITHI / Profil
- Information
|
11+ Jahre
Erfahrung
|
26
Produkte
|
216
Demoversionen
|
|
0
Jobs
|
0
Signale
|
0
Abonnenten
|
👉 TELEGRAM @rakepips : https://t.me/rakepips
👍🏻 SUBSCRIBE TO MY YOUTUBE CHANNEL: https://www.youtube.com/c/RangingMarkets
📌 For a discount on my products or other requests, write me through https://t.me/Innovicient or innovicient@gmail.com
True Oversold Overbought MT4: https://www.mql5.com/en/market/product/68396
True Oversold Overbought MT5: https://www.mql5.com/en/market/product/79336
Hot Zones MT4: https://www.mql5.com/en/market/product/77292
Hot Zones MT5: https://www.mql5.com/en/market/product/77417
Outside The Box MT4: https://www.mql5.com/en/market/product/83143
Outside The Box MT5: https://www.mql5.com/en/market/product/76975
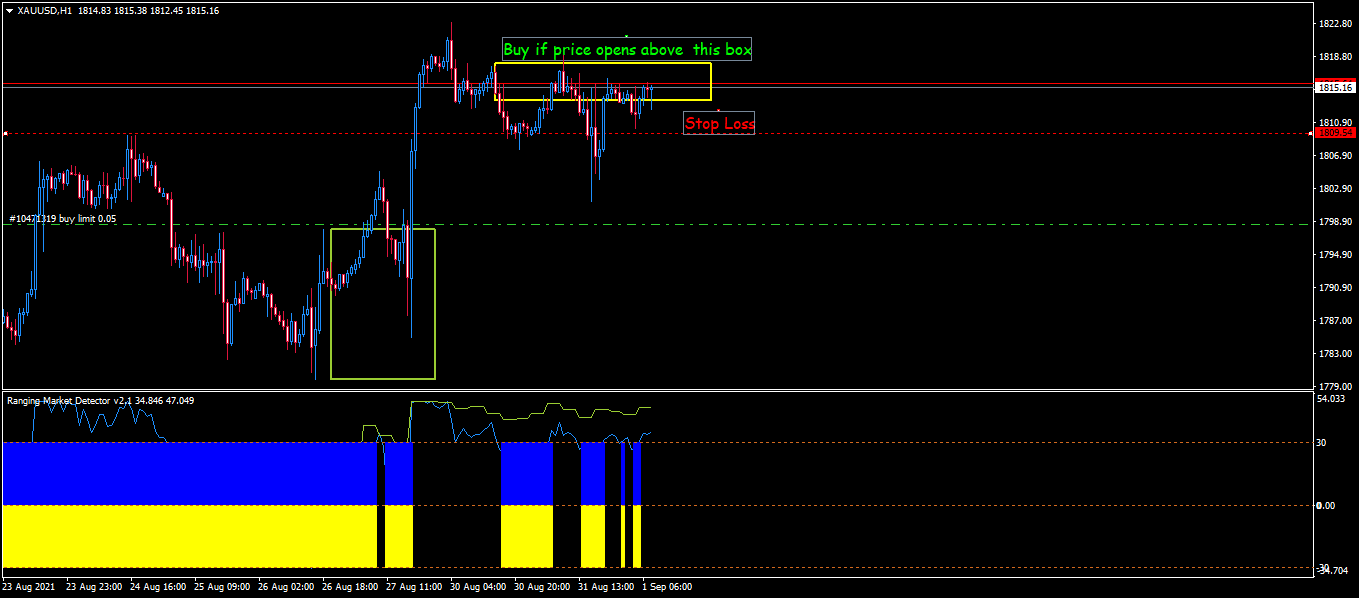
Ranging Market Detector MT4: https://www.mql5.com/en/market/product/66062
🏛 ALL EA https://www.mql5.com/en/users/pipmontra/seller
Doesn't matter whether the market is ranging within channels or trending. Retracement Feeder with default settings got your back.
👍🏻Retracement Feeder (MT4) : https://www.mql5.com/en/market/product/67443
👍🏻Retracement Feeder (MT5) : https://www.mql5.com/en/market/product/71340

Doesn't matter whether the market is ranging within channels or trending. Retracement Feeder with default settings got your back.
👍🏻Retracement Feeder (MT4) : https://www.mql5.com/en/market/product/67443
👍🏻Retracement Feeder (MT5) : https://www.mql5.com/en/market/product/71340
Indicators to use
Bollinger Band (Period:500, Shift: 0, Deviations:2)
True Oversold Overbought (mt4):: https://www.mql5.com/en/market/product/68396
Timeframe to trade: 1H Chart
Buy Rule: -
Make sure the price on 4H chart is above the main band (middle line)
On 1H chart, make sure the price is below the lower band.
Buy when the True Oversold Overbought mt4 indicator crosses -5000 from below. This way, you buy only when the price exits oversold state.
Sell Rule: -
Make sure the price on 4H chart is below the main band (middle line)
On 1H chart, make sure the price is above the upper band.
Sell when the True Oversold Overbought mt4 indicator crosses 5000 from above. This way, you sell only when the price exits overbought state.
✔️Get all retracements on time
✔️Works with all timeframes.
✔️Does NOT repaint.
🚀 Retracement Feeder MT5 :https://www.mql5.com/en/market/product/71340
✔️Get all retracements on time
✔️Works with all timeframes.
✔️Does NOT repaint.
🚀 Retracement Feeder MT5 :https://www.mql5.com/en/market/product/71340
🚀 Retracement Feeder MT4 : https://www.mql5.com/en/market/product/67443

✔️Get all retracements on time
✔️Works with all timeframes.
✔️Does NOT repaint.
🚀 Retracement Feeder MT5 :https://www.mql5.com/en/market/product/71340
🚀 Retracement Feeder MT4 : https://www.mql5.com/en/market/product/67443
👉Ranging Market Detector >> https://www.mql5.com/en/market/product/66062
🏛 ALL EA https://www.mql5.com/en/users/pipmontra/seller
👉 Here is the link» https://www.mql5.com/en/market/product/71340
Der Retracement Feeder sucht nach der ersten Bewegung nach Möglichkeiten für einen Rücksetzer. Grundsätzlich sucht er nach der zweiten Welle des Trends. Er funktioniert mit jedem Finanzinstrument, Der Retracement Feeder wechselt nicht die Farbe und löscht keine Pfeile, Einfach einzustellen und zu verwenden. Funktioniert hervorragend mit Renko Charts ________________________________________ MT4 Version | Am besten verwendet mit: Market Heart MT5| Wie es funktioniert Der Indikator basiert auf dem
Trendy Stock ist ein Preisverfolgungsindikator, der die Stochastik verwendet, um zu zeigen, wann der Preis den überverkauften oder überkauften Bereich verlässt. Der Algorithmus ermöglicht es Ihnen, länger in einem Trend zu bleiben, wenn die Bullen oder Bären die Kontrolle haben. Der Indikator ändert seine Farbe, sobald der Preis den überverkauften/überkauften Bereich verlässt. Kurz gesagt, die [roten] Abwärtstrend-Balken beginnen zu malen, wenn der Kaufdruck nachlässt, während die [grünen]
Follow: https://www.mql5.com/en/blogs/post/745521
The Ranging Market Detector yellow green signal line is above 0.✔️
On the Chart, the candle has closed above previous high (Yellow Box).✔️
Since the preceding candle is more than 100 pips, wait for the price to touch the yellow box or candle to close in the box and then BUY ✔️
https://www.mql5.com/en/blogs/post/745437
👉Open buy trades after the indicator line crosses -5000 and sell when the line drops below 5000: These methods allow you to open trade early. The best results are in higher timeframes. As you probably already know, the best place to check for oversold or overbought status is in the higher timeframes.
See the example below.
Download your copy today.
👉True Oversold Overbought: https://www.mql5.com/en/market/product/68396
True Oversold Overbought in action
👉Secondly, if you want to re-enter the trend:
Buy when the candle opens above the previous high (where the positive spike was last formed)
Sell when the candle opens below the previous low (where the negative spike was last formed)
Just Subscribe to our @rangingmarket Telegram group | @rangingmarkets Telegram Channel for community support
This indicator is now able to give accurate oversold/overbought levels. 👉True Oversold Overbought: https://www.mql5.com/en/market/product/68396
https://www.mql5.com/en/market/product/68396
🔺 When the "Super Charge" feature is enabled, the areas where the price is in oversold/overbought status are amplified to give you a clear state of the market,therefore, you will not miss the moment to prepare for a reversal/retracement (over 5000 is overbought and below -5000 is oversold ; buy when indicator closes above -5000 and sell when it closes below 5000).
🔺 Alternatively, when the "Super Charge" feature is disabled, the indicator still shows the oversold and overbought levels but this time you get a broader view of the market (over 80 is overbought and below -80 is oversold; buy when indicator closes above -80 and sell when it closes below 80).
Step 1: Enable Draw Convergence/Divergence Lines
Step 2: Leave MFI, RSI & Stochastic in default settings
Step 3: Select option Averaged MFI & RSI & Stoc in the drop down.
BUY
1. Buy Convergence or Divergence lines appear when the indicator is Below 50
2. Open buy order when the indicator crosses above 50
Closing positions
a. close loss: when indicator moves back below 50
b. close profit: when the sell divergence /convergence appears
SELL
1. Sell Convergence or Divergence lines appear when the indicator is Above 50
2. Open sell order when the indicator crosses below 50
Closing positions
a. close loss: when indicator moves back above 50
b. close profit: when the buy divergence /convergence appears
https://www.mql5.com/en/market/product/69003#!tab=comments&page=1&comment=23472601
Einführung Die Convergence Divergence Suite enthält 17 Indikatoren , integrierte technische MT4-Indikatoren und kundenspezifische Indikatoren . Die Liste wird in den folgenden Versionen entsprechend den Wünschen der Benutzer erweitert. Jeder gewählte Indikator wird auf Ihren Chart geladen, dann werden automatisch Konvergenz- und Divergenz-Trendlinien auf dem Chart und dem Indikator gezeichnet. Dieses Tool ist wichtig, wenn Sie einen der aufgeführten Indikatoren oder Konvergenz/Divergenz in


