Robert Gerald Wood / Profil
- Software Developer in FXBunnywood
- Vereinigtes Königreich Großbritannien und Nordirland
- 4316
- Information
3 Jahre
Erfahrung
|
26
Produkte
|
26
Demoversionen
|
0
Jobs
|
0
Signale
|
0
Abonnenten
|
Weitere Informationen zu meinen Produkten finden Sie unter https://www.bunnywood.co.uk
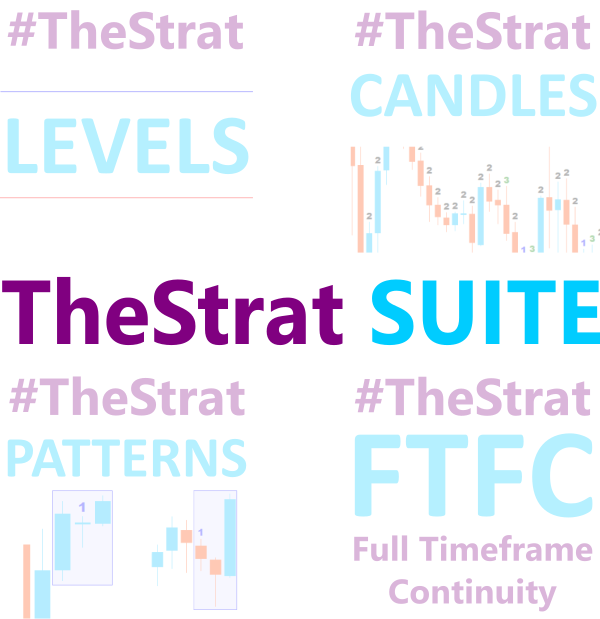
Wenn Sie neugierig auf TheStrat sind, besuchen Sie https://www.thestrat-indicators.com/about für weitere Informationen.
This indicator draws the prior Highs and Lows for multiple timeframes, and can display potential Take Profit and Stop Loss levels. In Rob Smith's # The Strat terms, these are potential entry points, or alternatively potential targets for open positions. I like to use them in both ways. On a lower timeframe, say 5 minutes to get a good entry on a daily or weekly level, and then as a potential target. Very small stops required giving an excellent risk/reward ratio. Key Features
This indicator will draw patterns based on Rob Smith's The Strat as they emerge in real time on your chart. As price evolves, TheStrat offers 18 distinct price action patterns that can help you get good entries in the market. Each pattern involves two or three candles, and this indicator will draw a bounding box around the candles and name the pattern. The indicator also shows when a potential setup is forming, known by stratters as an Actionable signal
This indicator will draw a label above or below each candle based on Rob Smith's The Strat as they develop over time on your chart. As price evolves, a candle can switch between three states. When the candle first opens, if it sits completely within the previous candles high and low, then it will start as a Type 1. As time moves on, if it breaks either the high or low of the previous candle, it will be come a type 2, and should the price action be volatile and
Die Märkte lieben runde Zahlen wirklich und sie wirken oft als Unterstützung in einem fallenden Markt oder als Widerstand, wenn der Preis steigt. Dieser Indikator wurde entwickelt, um Preisniveaus bei runden Werten zu zeichnen. Dies geschieht automatisch, aber Sie haben auch die Möglichkeit, dies zu überschreiben und die Ebenen zu bestimmen, die Sie sehen möchten. Ein rundes Niveau kann so einfach sein wie 10er-Schritte, also 10, 20, 30 usw., oder wenn Sie mit Forex arbeiten, möchten Sie
This script allows you to toggle the "Show Trade Levels" option, but for the current chart only. Normally, you can only change the setting using the Options -> Chart menu for ALL charts, but this script allows you to do it for a SINGLE chart. I'm using it when I take screenshots, because most of the time I'm not trying to show the trades, just some functionality of one of my other tools. Iif you need that functionality, then this script is very helpful! If the script helps you, please let me
Ich habe diesen einfachen Indikator erstellt, während ich etwas über Rob Smiths TheStrat lernte, und finde ihn so hilfreich, dass ich dachte, ich würde ihn mit Ihnen teilen. Wenn Sie es nützlich finden, schauen Sie sich bitte die anderen Indikatoren an, die ich auf MQL5 veröffentlicht habe. Der Indikator zeichnet einfach eine einzelne Linie auf dem Chart, die das von Ihnen ausgewählte Preisniveau aus einem höheren Zeitrahmen anzeigt. Mit den Einstellungen haben Sie die volle Kontrolle über den
FTFC bezieht sich auf Full Timeframe Continuity, wie in Rob Smiths The Strat definiert. Dieser Indikator zeichnet zwei Linien auf dem Chart, eine der höchsten der vierteljährlichen, monatlichen, wöchentlichen, täglichen oder stündlichen Eröffnungsniveaus und die zweite der niedrigsten dieser Werte. Dadurch erhalten Sie einen Kanal, über oder unter dem der Handel eher sehr stark in eine Richtung verläuft. Zwischen den Linien wird die Preisbewegung abgehackter und Sie können breitere
Dieser Indikator zeichnet eine Beschriftung über oder unter jeder Kerze, basierend auf Rob Smiths Die Strat wie sie sich im Laufe der Zeit auf Ihrem Diagramm entwickeln. Wenn sich der Preis entwickelt, kann eine Kerze zwischen drei Zuständen wechseln. Wenn sich die Kerze zum ersten Mal öffnet und vollständig innerhalb der vorherigen Kerzen hoch und niedrig sitzt, beginnt sie als Typ 1. Wenn sie im Laufe der Zeit entweder das Hoch
This indicator draws the prior Highs and Lows for multiple timeframes, and can display potential Take Profit and Stop Loss levels. In Rob Smith's # The Strat terms, these are potential entry points, or alternatively potential targets for open positions. I like to use them in both ways. On a lower timeframe, say 5 minutes to get a good entry on a daily or weekly level, and then as a potential target. Very small stops required giving an excellent risk/reward ratio. Please
This indicator will draw patterns based on Rob Smith's The Strat as they emerge in real time on your chart. As price evolves, TheStrat offers 18 distinct price action patterns that can help you get good entries in the market. Each pattern involves two or three candles, and this indicator will draw a bounding box around the candles and name the pattern. The indicator also shows when a potential setup is forming, known by stratters as an Actionable signal. Candles Each candle is defined by its
This indicator is designed to make reviews of many charts on different timescales quicker, and easier to do. Track Time and Price across multiple charts Change Symbol on one chart and all other charts of the same symbol will be changed too. Easy to use, quick to master The indicator allows you to identify the price and time where the mouse pointer is on the current chart, across all other charts open on the same Symbol. This allows you to quickly see information on multiple charts whereas
A simple script that can delete all the drawing objects on a chart, or just the objects of a specific type. Settings: DeleteObjectsOfType By default the value will be blank which means ALL drawing objects on the chart will be deleted. If you only wish to delete specific types of drawing object, change this setting to the type of object to delete. For example, Fibonacci Retracement, Text, Label or Trend Line. Please see the demonstration video for more information
Mit diesem Skript können Sie beliebige Zeichnungsobjekte wie Trendlinien, Fibonachi-Retracements usw. in einen oder mehrere andere Charts kopieren. Standardmäßig kopiert das Skript alle Objekte auf dem aktuellen Chart, d. h. dem Chart, auf den das Skript angewendet wurde, in jeden anderen Chart mit demselben aktuell geladenen Symbol. Einstellungen ZielZeitrahmen Wenn es auf etwas anderes als PERIOD_CURRENT eingestellt ist, kopiert es die Objekte in jeden offenen Chart mit demselben Symbol wie