Pierre Ksachikian / Profil
- Information
|
3 Jahre
Erfahrung
|
34
Produkte
|
17
Demoversionen
|
|
0
Jobs
|
0
Signale
|
0
Abonnenten
|
Der MP Screener ist ein leistungsstarkes und benutzerfreundliches Tool für Händler, die mehrere Symbole nach verschiedenen technischen Kriterien filtern und analysieren müssen. Egal, ob Sie Scalper, Daytrader oder Swingtrader sind, dieser Screener hilft Ihnen, schnell die besten Handelsmöglichkeiten auf dem Markt zu identifizieren, indem er mehrere Zeitrahmen und Indikatoren in Echtzeit scannt. Mit dem MP Screener können Händler ihre Marktanalyse rationalisieren und sich so leichter auf
Dieser Indikator bietet Einblicke in die Werte des Relative Strength Index (RSI) über mehrere Zeitrahmen. Er hebt den prozentualen Anteil der RSI-Werte über verschiedene Zeiträume hervor, die als überkauft oder überverkauft eingestuft werden, und berechnet außerdem den Durchschnitt dieser RSI-Werte. Der prozentuale Anteil der überkauften oder überverkauften RSI-Werte wird außerdem verwendet, um adaptive Schwellenwerte für diese Werte zu definieren. Einstellungen: Maximale Länge: Legt die
MP Close By Verlust oder Gewinn für MT5 Der Grund, warum ich diesen Experten erstellt habe, ist, dass ich möchte, dass Händler, die bereits herausgefunden haben, wie sie auf dem Markt profitabel sein können, ein einfacheres Werkzeug während ihrer Handelstage benutzen. Dieser Experte wird Ihre Exposition von Trades berücksichtigen und sie auf der Grundlage von Gewinnzielen und Verlusten, die Sie für Ihr eigenes Risikomanagement festlegen, schließen. Ich möchte mich bei meinem Freund bedanken
Dieses Tool identifiziert bestimmte Kerzenöffnungszeiten auf dem Chart. Dies kann Ihnen helfen, Ihre bevorzugten Kerzenöffnungen zu erkennen und sie so zu verwenden, wie es in Ihre Strategie passt. Dieses Tool ist sehr nützlich für das Intraday-Charting und die Anzeige Ihrer Sitzungen. ___________________________________________________________________________________ Haftungsausschluss : Handeln oder investieren Sie NICHT auf der Grundlage der in diesem Kanal vorgestellten Analysen. Stellen
Dieses Tool identifiziert bestimmte Kerzenöffnungszeiten auf dem Chart. Dies kann Ihnen helfen, Ihre bevorzugten Kerzenöffnungen zu erkennen und sie so zu verwenden, wie es in Ihre Strategie passt. Dieses Tool ist sehr nützlich für das Intraday-Charting und die Anzeige Ihrer Sitzungen. ___________________________________________________________________________________ Haftungsausschluss : Handeln oder investieren Sie NICHT auf der Grundlage der in diesem Kanal vorgestellten Analysen. Stellen
Der Kerzengrößen-Oszillator ist ein einfach zu bedienendes Werkzeug, um die Kerzengröße vom höchsten bis zum niedrigsten Preis jeder Kerze zu ermitteln. Es ist ein leistungsstarkes Tool für Preisaktionsanalysten, insbesondere für diejenigen, die mit Intraday-Charts arbeiten, und auch ein perfektes Tool für kurzfristige Swing-Trader. Bitte beachten Sie, dass Sie die Bullish- und Bearish-Kerzen auch mit verschiedenen Farben bearbeiten können. #Tags: Kerzengröße, Oszillator, Preisaktion
Der MP-Preisänderungsindikator ist ein Werkzeug zur Berechnung der prozentualen Preisbewegung. Der Wert dieses Indikators kann so eingestellt werden, dass er die prozentuale Preisänderung innerhalb bestimmter Zeitspannen anzeigt. Dieser Indikator ist ein leistungsfähiges Instrument, wenn er zusammen mit anderen Indikatoren wie ATR und ADR verwendet wird, um Preisschwankungen und Toleranz in verschiedenen Strategien zu verstehen
Der MP-Preisänderungsindikator ist ein Werkzeug zur Berechnung der prozentualen Preisbewegung. Der Wert dieses Indikators kann so eingestellt werden, dass er die prozentuale Preisänderung innerhalb bestimmter Zeitspannen anzeigt. Dieser Indikator ist ein leistungsfähiges Instrument, wenn er zusammen mit anderen Indikatoren wie ATR und ADR verwendet wird, um Preisschwankungen und Toleranz in verschiedenen Strategien zu verstehen
Der Kerzengrößen-Oszillator ist ein einfach zu bedienendes Werkzeug, um die Kerzengröße vom höchsten bis zum niedrigsten Preis jeder Kerze zu ermitteln. Es ist ein leistungsstarkes Tool für Preisaktionsanalysten, insbesondere für diejenigen, die mit Intraday-Charts arbeiten, und auch ein perfektes Tool für kurzfristige Swing-Trader. Bitte beachten Sie, dass Sie die Bullish- und Bearish-Kerzen auch mit verschiedenen Farben bearbeiten können. #Tags: Kerzengröße, Oszillator, Preisaktion
https://www.mql5.com/en/market/product/98635

https://www.mql5.com/en/market/product/98633

Dieser Trend-Scanner-Indikator verwendet zwei Hauptindikatoren, um Trends zu erkennen. Zunächst die EMAs, die einen Überblick über das Bullish/Bearish-Momentum geben. Wenn der kürzere EMA (berechnet auf der Grundlage aktuellerer Kursbewegungen) den langsameren EMA (berechnet auf der Grundlage längerer Kursbewegungen) kreuzt oder darüber liegt, deutet dies darauf hin, dass sich der Markt in einem Aufwärtstrend befindet. Zweitens der Stochastik RSI: Wenn der RSI < 20 ist, gilt er als
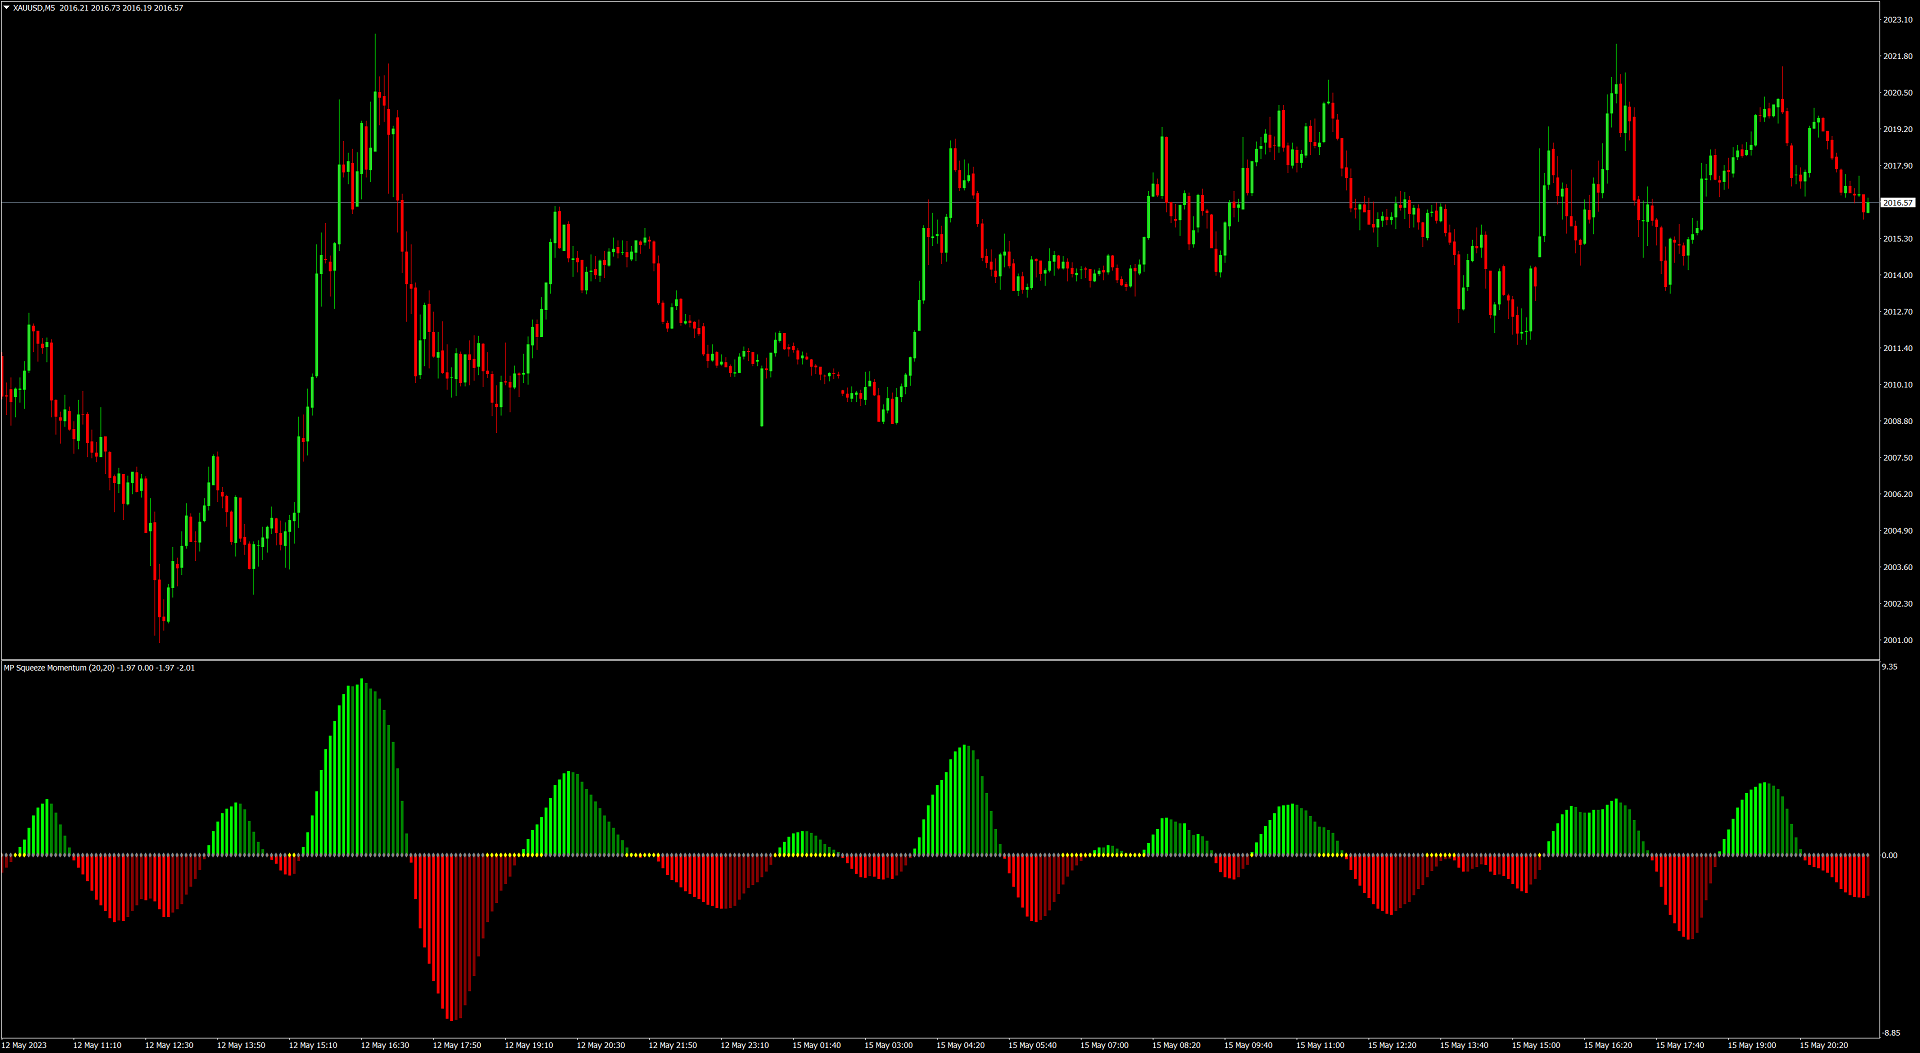
MP Squeeze Momentum ist ein Volatilitäts- und Momentum-Indikator, der aus dem von John Carter eingeführten Volatilitätsindikator "TTM Squeeze" abgeleitet wurde. Er nutzt die Tendenz, dass der Kurs nach einer Konsolidierung in einer engen Spanne stark ausbricht. Einführung: Die Volatilitätskomponente des MP Squeeze Momentum misst die Preiskompression anhand von Bollinger Bändern und Keltner-Kanälen. Wenn die Bollinger Bänder vollständig von den Keltner-Kanälen umschlossen sind, deutet dies auf
Der MP Candle Countdown-Indikator mit Fortschrittsbalken ist ein Hilfsmittel für die technische Analyse, das die verbleibende Zeit bis zum Schließen der aktuellen Kerze auf einem Diagramm anzeigt, zusammen mit einem Fortschrittsbalken, der die seit dem Öffnen der Kerze verstrichene Zeit visuell darstellt. Dieser Indikator kann für Händler, die Candlestick-Charts verwenden, um Handelsentscheidungen zu treffen, hilfreich sein, da er sowohl die verbleibende Zeit bis zum Schließen einer Kerze als
https://www.mql5.com/en/market/product/96593

Eine Heatmap ist eine grafische Darstellung von Daten in zwei Dimensionen, bei der verschiedene Faktoren durch Farben dargestellt werden. Heatmaps sind ein hilfreiches visuelles Hilfsmittel für Betrachter, das die schnelle Verbreitung von statistischen oder datenbasierten Informationen ermöglicht. Der MP-Heatmap-Indikator bietet eine grafische Darstellung der relativen Stärke der wichtigsten Währungen im Vergleich zu anderen, indem er Daten von Paaren in farbkodierte Ergebnisse umwandelt und
https://www.mql5.com/en/market/product/95082
Dieser kreative, einfache Indikator bietet einen präzisen Rahmen für die Marktstimmung innerhalb der technischen Analyse verschiedener Zeitrahmen. Für Händler wie mich, die regelmäßig die "Mark Fisher" -Strategie anwenden, ist dies ein perfekter Indikator, um einen Einblick in die Märkte von der kurz- bis zur langfristigen Perspektive zu erhalten, indem man die Tiefst- und Höchststände der Kerzen als Haltepunkte verwendet und perfekt mit der "Price Action" kombiniert. Für weitere Optionen und
https://www.mql5.com/en/market/product/94823

Dieser kreative, einfache Indikator bietet einen präzisen Rahmen für die Marktstimmung innerhalb der technischen Analyse verschiedener Zeitrahmen. Für Händler wie mich, die regelmäßig die "Mark Fisher" -Strategie anwenden, ist dies ein perfekter Indikator, um einen Einblick in die Märkte von der kurz- bis zur langfristigen Perspektive zu erhalten, indem man die Tiefst- und Höchststände der Kerzen als Haltepunkte verwendet und perfekt mit der "Price Action" kombiniert. Für weitere Optionen und


