Pablo Ibanez Porcel / Profil
- Information
|
10+ Jahre
Erfahrung
|
8
Produkte
|
136
Demoversionen
|
|
0
Jobs
|
0
Signale
|
0
Abonnenten
|
Marktzonen MT5 Dieser Indikator ermöglicht ein einfaches Ablesen des Marktes auf der Grundlage statistischer Gaußscher Niveaus, genau wie die Market Profile®-Methode. Mithilfe einer einzigartigen Formel schätzt der Indikator dynamisch die Zonen, die am besten repräsentieren, wo die Marktbewegungen die meiste Zeit (ca. 70% der Zeit) verbleiben werden. Dadurch können wir den Markt auf einfachere Weise betrachten und vermeiden, in nicht relevante Bewegungen zu geraten. Innerhalb der markierten
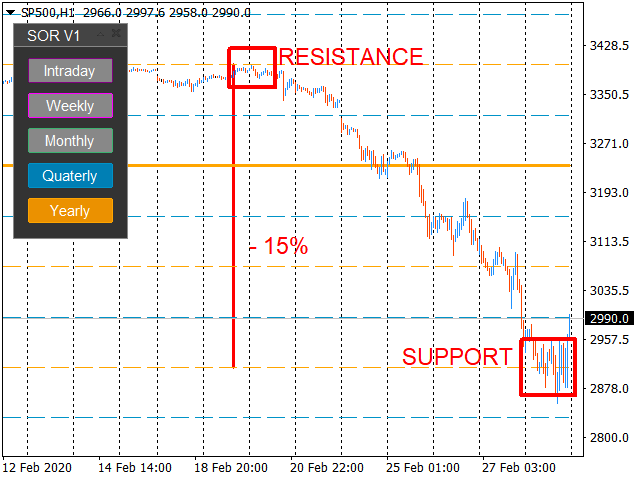
Control Trading Unterstützung und Widerstand Es handelt sich um einen unabhängigen Indikator des TimeFrame, der es ermöglicht, die wichtigsten Marktniveaus je nach dem Zeitrahmen des Handels zu projizieren. Die Farben des Indikators sind so gewählt, dass sie zwischen den verschiedenen Arten von Niveaus unterscheiden und die wichtigsten Niveaus hervorheben. Dieser Indikator ermöglicht es, auf demselben Diagramm die möglichen relevanten Ziele zu visualisieren, die verschiedene Trader nach
Control Trading Unterstützung und Widerstand Es handelt sich um einen unabhängigen Indikator des TimeFrame, der es ermöglicht, die wichtigsten Marktniveaus je nach dem Zeitrahmen des Handels zu projizieren. Die Farben des Indikators sind so gewählt, dass sie zwischen den verschiedenen Arten von Niveaus unterscheiden und die wichtigsten hervorheben. Dieser Indikator ermöglicht es, auf demselben Diagramm die möglichen relevanten Ziele zu visualisieren, die verschiedene Trader nach verschiedenen
Markt-Zonen Dieser Indikator bietet eine einfache Möglichkeit, auf der Grundlage von Gauß'schen statistischen Niveaus zu handeln, die der Methodik des Market Profile ® ähneln. Unter Verwendung einer exklusiven Formel schätzt der Indikator dynamische Zonen, in denen die Marktbewegungen statistisch gesehen die meiste Zeit (70%) verbleiben. Dies ermöglicht es, den Markt auf eine vereinfachte Art und Weise zu sehen und zu vermeiden, nicht relevanten Barbewegungen zu folgen. Die Preise bleiben
Zeigt auf dem Chart ein Histogramm mit zwei gleitenden Durchschnitten. Es ermöglicht das Senden von Alarmen an die MetaTrader-Plattform, wenn die Kreuzungen auftreten. Sie können ihn auf jedem Zeitrahmen verwenden, die Einstellungen der gleitenden Durchschnitte können angepasst werden, ebenso wie das Aussehen und die Farben. Die Parameter des Indikators sind Periode des schnellen gleitenden Durchschnitts Dauer des langsamen gleitenden Durchschnitts Modus des gleitenden Durchschnitts Gleitender
Intraday Levels zeigt ein Raster für Intraday-Levels für den Intraday-Handel Zeigt ein Raster für die Tageslevels an, das Ihnen eine Orientierungshilfe bietet, um den Trend zu erkennen und Intraday-Trades zu messen (Stop-Loss und Take-Profit). Die Parameter sind: Levels Modus: Grundmodus: Zeigt das höchste, niedrigste und mittlere Niveau an. Erweiterter Modus: Zeigt das höchste, niedrigste, mittlere und mittlere Niveau an. Fibonacci-Modus: Zeigt die Fibonacci-Retracements der Sitzung an
Sucht nach jedem Symbol auf MT4 MarketWatch. Das System Stoller% verwendet Williams% und StarcBands zur Berechnung von Trends, Ein- und Ausstiegen. Funktioniert nur für den H1-Zeitrahmen. Eingabeparameter: Periode: Anzahl der zu durchsuchenden Balken. Refresh_min: Anzahl der Minuten, die zwischen den Suchen gewartet werden sollen. ShowTrendChanges: Zeigt Signale bei Trendänderungen an. ErweiternZeitraum: Erweitert den Zeitraum für die Berechnung der Signalreihenfolge. UseADXFilter: Bestätigt den
Control Trading Intraday Zones zeigt die besten Kerzen-Zonen für den Intraday-Handel. Zeigt die Zonen des Tagesmaximums und des Tagesminimums an, die an jedes Symbol anpassbar sind, und gibt Ihnen einen Leitfaden, um die besten Zonen für den Intraday-Handel zu finden. Der Indikator geht von -100 (niedrigster Kurs des Tages) bis 100 (höchster Kurs des Tages), wobei 0 der mittlere Kurs des Tages ist. Wenn der Kurs zum Beispiel den Tageshöchststand erreicht, zeigt der Indikator weiterhin maximale


