已发布的产品

Volumeshadow – CVD 背离指标 Volumeshadow 可将 累计成交量差值(Cumulative Volume Delta,CVD) 直接显示在价格图表上,使交易者能够一目了然地观察买卖双方力量的变化。该指标以每根K线上的彩色阴影形式展示 CVD,有助于识别潜在的 CVD 背离。 该指标基于 Tick 成交量 ,特别适用于 Forex(外汇)和 CFD(差价合约)交易者,可有效分析类似 Order Flow(订单流) 的市场信息。 主要特点 • CVD 直接显示在主图,无需单独窗口
• 提前识别 CVD 背离
• 基于 Tick 成交量,特别适合外汇和 CFD 交易
• CVD 每日自动重置
• 仅基于已收盘K线进行计算,不会重绘(No Repaint)
• 界面清晰简洁,不影响图表阅读,提升市场分析效率 我个人对该指标的理解(简单示例) 5 分钟图是我最常使用的时间周期。 看跌背离 价格:Equal High(相同高点)
CVD:明显的 Higher High(更高高点) 或 价格:Lower High(更低高点)
CVD:Equal High(相同
FREE

MarketProfileShadow MarketProfileShadow 是一款基于交易时段(Session)的 MT5 成交量分布(Volume Profile)指标,用于可视化预定义交易时段内的成交量分布情况。该指标计算并绘制 Point of Control (POC) 、 Value Area High (VAH) 和 Value Area Low (VAL) ,并对 Value Area 区域进行高亮显示。 该指标经过性能优化:正在进行中的交易时段仅每 5 分钟 更新一次,而已结束的交易时段不会再次计算。 使用说明 MarketProfileShadow 主要针对 5 分钟图(M5) 开发,在该时间周期下能够最有效地反映市场接受度、成交量分布以及交易时段分析。 该指标适用于 M30 及以下 的时间周期。随着时间周期的增大,不同市场阶段和交易活动会逐渐混合,因此交易时段成交量分布的分析价值会相应降低。 因此,不建议在 M30 以上 的时间周期中使用该指标,因为在这些周期下,成交量分布通常已无法提供额外的分析价值, 除非您的分析重点是 Value Area Low、Valu
FREE

CandlePOC Pro – Point of Control for Every Single Candle CandlePOC Pro is a professional MT5 indicator that visualizes the Point of Control (POC) of every individual candle directly on the chart. For each completed candle, the price level with the highest trading activity is identified and displayed as a horizontal line. The calculation is based on MetaTrader 5 Tick Volume , allowing traders to identify the price levels where the highest amount of activity occurred within each candle. Once a can
FREE

Professional Trend ADX Professional Trend ADX 是一款专为 MetaTrader 5 开发的强大趋势强度指标,将经典 ADX(平均趋向指数) 与直观的 Power(动能)/成交量柱状图 相结合。与传统需要在独立指标窗口中分析趋势强度不同,本指标直接在主图中显示 ADX 曲线和 Power 柱状图,使交易者能够更快识别趋势形成、趋势延续以及动能减弱。 该指标特别适合 日内交易者(Intraday Trader) 、 剥头皮交易者(Scalper) 和 短线交易者(Day Trader) ,帮助他们无需在多个指标之间切换,即可快速判断市场走势的强弱。 推荐时间周期 推荐:M5 至 M30 本指标专为短期市场波动设计,在 5 分钟至 30 分钟 时间周期内表现最佳。 虽然更高时间周期同样适用,但其最大的分析价值体现在日内交易中。 工作原理 该指标由三个主要部分组成: ADX 趋势线 橙色 ADX 曲线用于显示当前趋势强度。 曲线上升 = 趋势正在增强 曲线下降 = 趋势正在减弱 与多头(Long)或空头(Short)方向无关 Power / 成交量
FREE

Candle Countdown Pro – Multi-Timeframe Candle Countdown for MetaTrader 5 Candle Countdown Pro is a professional multi-timeframe indicator for MetaTrader 5 that displays the remaining time until the next candle closes across multiple timeframes simultaneously. The indicator features a clean and easy-to-read countdown panel directly on the chart and supports all major timeframes from M1 to W1 . This allows you to instantly see when the next candle will close on every selected timeframe. The panel
FREE

Candle Status Pro – Multi-Timeframe Candle Status for MetaTrader 5 Candle Status Pro is a professional multi-timeframe indicator for MetaTrader 5 that displays the status of both the last closed candle and the current active candle across multiple timeframes in a clean and easy-to-read panel. Instead of displaying a countdown timer, the indicator visualizes the direction of each candle using colored candle icons. This allows you to instantly see whether the last or current candle of any selected
FREE
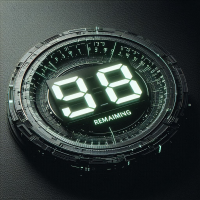
The Expert Advisor "TimeLeft Display" shows the remaining time until the close of the current candle in a digital display. The time is displayed in days, hours, minutes, and seconds. Features: Time Calculation: Calculates the remaining time until the close of the current candle based on the current timeframe of the chart. Digital Display: Shows the remaining time in a digital format. Customizable Font and Size: Allows selection of the font (Arial, Arial Black, Aptos Display, Tahoma,
FREE