Edoardo Centorame / 个人资料
- 信息
|
不
经验
|
12
产品
|
4
演示版
|
|
0
工作
|
0
信号
|
0
订阅者
|
我的工具不生成自动信号,但提供清晰且即时的技术分析支持,适合有经验的交易者和初学者。
请关注我的文章和更新,了解策略、优化及MT5高级交易工具的使用方法
Clarity is the key to success.
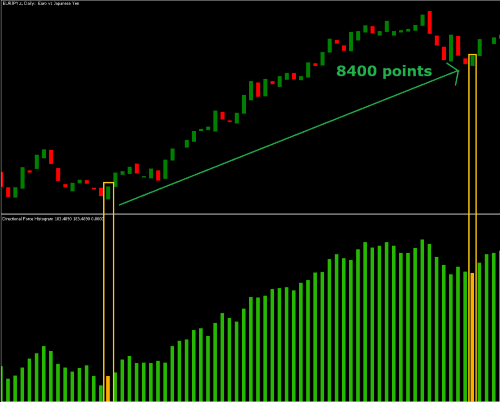
Clarity: https://www.mql5.com/it/market/product/162827?source=Site+Market+MT5+Indicator+Search+Rating006%3adirectional+force+histogram
10 February 2026
Equally important is trading with the trend. Going against the trend exposes traders to sudden reversals and frequent stop-outs, while trading in the direction of the trend allows you to take advantage of the market’s strength. The trend reflects the collective behavior of market participants—ignoring it means fighting the market.
In short: aligned timeframes + a clear trend = better risk control and higher-quality trading opportunities.
09 February 2026
Today’s traders combine data, algorithms, and disciplined risk management to navigate fast and complex markets. Technology has leveled the playing field, but success still depends on mindset: patience, consistency, and respect for risk. In modern trading, strategy beats emotion—every time.
Simple modern indicators:
https://www.mql5.com/it/market/product/163680?source=Site+Market+MT5+Indicator+Search+Rating006%3aTrend+vision
https://www.mql5.com/it/market/product/163689?source=Site+Market+MT5+Indicator+Search+Rating006%3amulti+timeframe+alignment
February 6, 2026
Financial markets move in cycles driven by psychology, liquidity, economic growth, and monetary policy. These cycles—typically divided into accumulation, expansion, distribution, and contraction—help explain why prices rise and fall over time rather than moving in a straight line.
Understanding market cycles is crucial for investors and traders because it improves timing, risk management, and decision-making. Recognizing where the market stands in a cycle can help avoid emotional mistakes, reduce exposure during risky phases, and take advantage of opportunities when probabilities are more favorable. In short, market cycles provide a framework to interpret price action and align strategies with broader market dynamics.
Indicator for drawing cycles: https://www.mql5.com/it/market/product/161510?source=Site+Market+MT5+Indicator+Search+Rating006%3acycles+plotter
February 5, 2026
February 4, 2026
Trading indicators are essential tools that help traders analyze market behavior and make more informed decisions. They transform raw price data into clear signals, making it easier to identify trends, momentum, volatility, and potential entry or exit points. While indicators do not predict the market with certainty, they reduce emotional trading and provide a structured, objective approach to understanding price movements. When used correctly and in combination with good risk management, indicators can significantly improve consistency and discipline in trading.
February 3, 2026
The PRO version of Multi-Timeframe Alignment has officially been released, bringing deeper analysis, smarter alerts and a fully professional trading experience.
Compared to the free version, Multi-Timeframe Alignment PRO introduces:
✔ Support for up to 5 configurable timeframes
✔ Visual strength bars for LONG, SHORT and FLAT percentages
✔ Percentage change tracking from the previous closed bar
✔ A powerful NO → YES smart alert system
✔ Push notifications to your phone via MetaTrader 5
✔ Cleaner visuals and a more professional layout
All calculations are based on closed bars only, ensuring stability, clarity and no repainting.
If you trade with context and want to know when multiple timeframes truly align, this PRO version is built for you.
👉 Download available here: https://www.mql5.com/en/market/product/163689?source=Site+Market+MT5+Indicator+Rating006
Multi-Timeframe Alignment PRO 是一款高级指标,旨在同时分析多个时间周期的市场一致性,并将这些信息转化为清晰、直观且易于理解的百分比 该指标的目标很简单:帮助你判断何时多个时间周期正在朝同一方向运行,从而提高交易决策的质量 这个 PRO 版本不仅仅是基础版本的图形扩展,而是引入了更深入的分析、更强的控制能力以及一套智能提醒系统,专为真实和专业交易使用而设计。 什么是多时间周期一致性(简单解释) 每个时间周期都可能讲述不同的市场故事。短周期可能是上涨,中周期可能是中性,而长周期可能是下跌。 当多个时间周期讲述同一个故事时,市场会变得更加有序,也更容易解读。 该指标衡量所选时间周期在 LONG、SHORT 或 FLAT 状态下的一致程度,并以百分比形式显示,因此你无需再去解读模糊不清的信号。 对于每一个选定的时间周期,指标都会显示 LONG、SHORT 和 FLAT 的百分比、每个百分比对应的彩色可视化条,以及与前一根K线相比的百分比变化(例如 +2.30% 或 −1.10%)。 最后,指标还会计算一个整体平均一致性,用来表示所有启用时间周期共同形成的主导方向。
The advanced, multi-timeframe evolution of the free Trend Vision Daily 📊
What’s new in the PRO version:
✅ Full multi-timeframe support (from M1 to Weekly, NO M30)
🔄 Automatic timeframe mapping based on the current chart
📈 Quarterly trend included on the Weekly timeframe
🧠 Clean, stable logic using closed bars only
🛠 Designed as a professional trend direction filter
💰 Price: ONLY 30 USD
Trend Vision PRO is not an entry signal, but a powerful tool to identify when the market offers a real directional advantage.
👉 Get the PRO version at the link below: https://www.mql5.com/it/market/product/163680?source=Site+Market+MT5+Indicator+Rating006
什么是 TREND VISION PRO TREND VISION PRO 是一款高级自适应多时间周期 Trend Direction Filter,旨在以自动且一致的方式,在几乎所有主要操作时间周期上提供对市场方向的结构化、层级化和情境化解读。 TREND VISION PRO 是 TREND VISION DAILY 的直接进化版本。DAILY 版本最初被有意限制在 D1 图表上,以提供简单而集中的趋势解读,而 PRO 版本则将同样的理念扩展为完整的多时间周期架构,能够根据图表时间周期动态适应。 它不是入场指标。 它不是经典振荡器。 TREND VISION PRO 是一种专业的市场环境工具,旨在定义市场何时提供真正的方向性优势,以及何时交易活动在统计上处于不利状态。 基本理念 TREND VISION PRO 的核心原则与 DAILY 版本保持一致,但被提升到了更高层次。市场方向是多种趋势力量与动量力量在不同时间尺度上相互作用的结果。 因此,TREND VISION PRO 不依赖单一信号,不会对价格作出冲动式反应,也不试图预测反转。相反,它整合了来自不同专业指标家族的概念,例如
In the late 19th century, traders began plotting prices by hand on paper, transforming raw numbers into visual trends.
Pioneers like Charles Dow realized that charts don’t predict the market — they reveal its behavior.
From those early drawings came the foundations of modern technical analysis.
January 30, 2026
We are excited to introduce Multi-Timeframe Alignment, a powerful context-analysis indicator designed to show how well multiple selected timeframes are truly aligned with each other.
This indicator does not generate entry signals and does not predict the market. Instead, it provides a clear, quantitative view of trend coherence across different timeframes, helping traders better understand market structure and avoid low-quality conditions.
✅ Clean and intuitive visual panel
✅ Multi-timeframe alignment at a glance
✅ Ideal as a trend filter or context tool
🔓 The BASE version is available for FREE, allowing everyone to explore the core functionality of Multi-Timeframe Alignment at no cost.
🚧 A PRO version with extended features and advanced options will be released in the future.
📥 You can download the FREE version here:
👉 https://www.mql5.com/it/market/product/163549?source=Site+Market+MT5+Indicator+Rating006
Higher highs and higher lows often signal a strong uptrend, showing that buyers are in control.
Lower highs and lower lows, on the other hand, usually point to a downtrend, where sellers dominate.
By reading these simple structures, traders can better understand market direction, spot potential reversals, and make more disciplined decisions—before emotions take over.
January 29, 2026
We are excited to announce the release of TREND VISION DAILY, a powerful professional trend direction filter designed to clearly identify the dominant market bias using a structured multi-timeframe approach.
TREND VISION DAILY analyzes market behavior by combining multiple trend and momentum concepts inspired by indicators such as MACD, TRIX, RSI, Bulls and Bears Power, providing a clean and reliable market context.
It is not an entry signal, but a high-quality decision support tool that helps traders understand when the market offers a real directional advantage and when it is better to stay out.
✅ Multi-timeframe logic (Monthly, Weekly, Daily)
✅ Clean and intuitive visual display
✅ No repaint – based on closed candles only
✅ Ideal for swing and position trading
🎁 TREND VISION DAILY will be available for FREE
📥 Download link: https://www.mql5.com/it/market/product/163510?source=Site+Market+MT5+Indicator+Rating006
Clear decisions come from a steady mind, not from fear or excitement.
Staying cool allows you to follow your strategy, manage risk, and think long-term—even when the market tests your nerves.
January 28, 2026
It creates opportunity, but it also amplifies risk. Prices move fast, emotions move faster—and that’s where discipline matters most. Successful traders don’t fear volatility; they respect it, manage it, and adapt their strategy to it. In the end, it’s not about predicting every move, but about surviving the swings long enough to grow.
January 27, 2026
We are proud to announce the official release of CCI “FIXED DUAL”, a new advanced Trend Direction Filter designed for professional traders and multi-timeframe market analysis.
CCI “FIXED DUAL” is not a simple indicator, but a high-level market context tool capable of:
identifying the dominant market direction
evaluating the structural quality of the trend
effectively filtering market noise and ranging phases
Thanks to its multi-layer LWMA structure and the built-in multiplier system, it enables a powerful DUAL WINDOW approach:
👉 higher window for the primary trend,
👉 lower window for operational timing.
Designed for Daily, Weekly, and Monthly timeframes, it is ideal as a directional filter for discretionary trading and automated systems.
CCI “FIXED DUAL”
📊 Clarity. Structure. Direction.
🔗 Download available here:
https://www.mql5.com/it/market/product/163204?source=Site+Market+MT5+Indicator+Rating006
什么是 CCI FIXED DUAL CCI FIXED DUAL 是一个专业级 Trend Direction Filter,旨在精准识别: 市场的主导方向 走势的结构质量 主趋势与加速阶段之间的一致性 它不是一个直接入场指标。 它不是一个传统振荡器。 它是一个市场环境工具,旨在帮助交易者决定何时交易以及何时不交易,从而大幅减少市场噪音和判断错误。 CCI FIXED DUAL 的基本理念 CCI FIXED DUAL 所基于的原则简单但强大: 一个信号只有在与市场结构一致时才有价值。 因此,该指标: 不使用单一数值 不会对价格做出冲动反应 不会刻意寻找反转点 而是建立在以下基础之上,构建出一种层级化的趋势解读: 基于 Typical Price 的 CCI 不同速度的 LWMA 移动平均线 短期 中期 和长期之间的动态比较 因此,其结果是对市场方向的一种稳定 干净 且可靠的表达。 指标的技术结构: CCI FIXED DUAL 由四个主要部分组成,全部显示在独立窗口中。 1 CCI magenta 线 这是指标的信息基础。 衡量典型价格的偏离程度 提供应用平滑处理的原始材料