Trading Session ICT KillZone
- 指标
- Han Qin Lin
- 版本: 6.1
- 更新: 13 十二月 2023
交易时段,市场时间,时段时间,外汇时间,交易时间表,市场开放/关闭时间,交易时区,时段指标,市场时钟,ICT,亚洲KillZone,伦敦Killzone,纽约Killzone
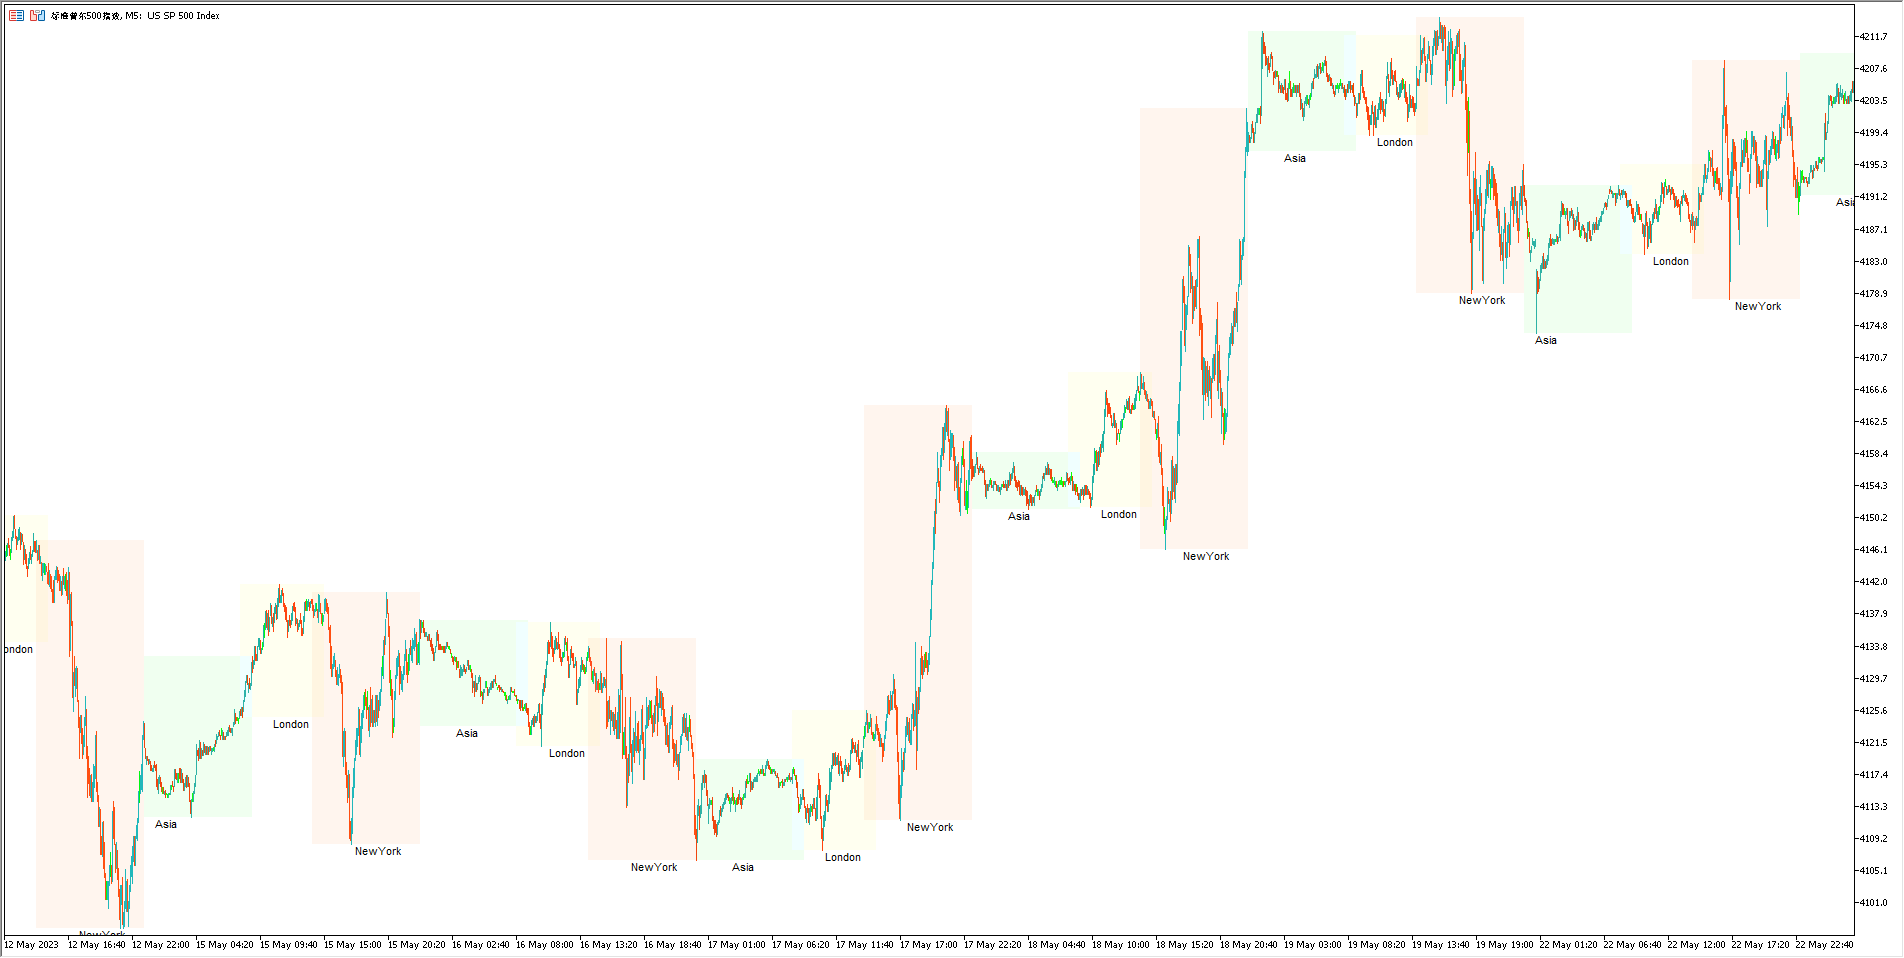
交易者应该注意交易时区的影响,因为不同的市场活动时间和交易量直接影响货币对的波动性和交易机会。为了帮助交易者全面了解市场情况并更好地制定交易策略,我们开发了一个交易会话指标。
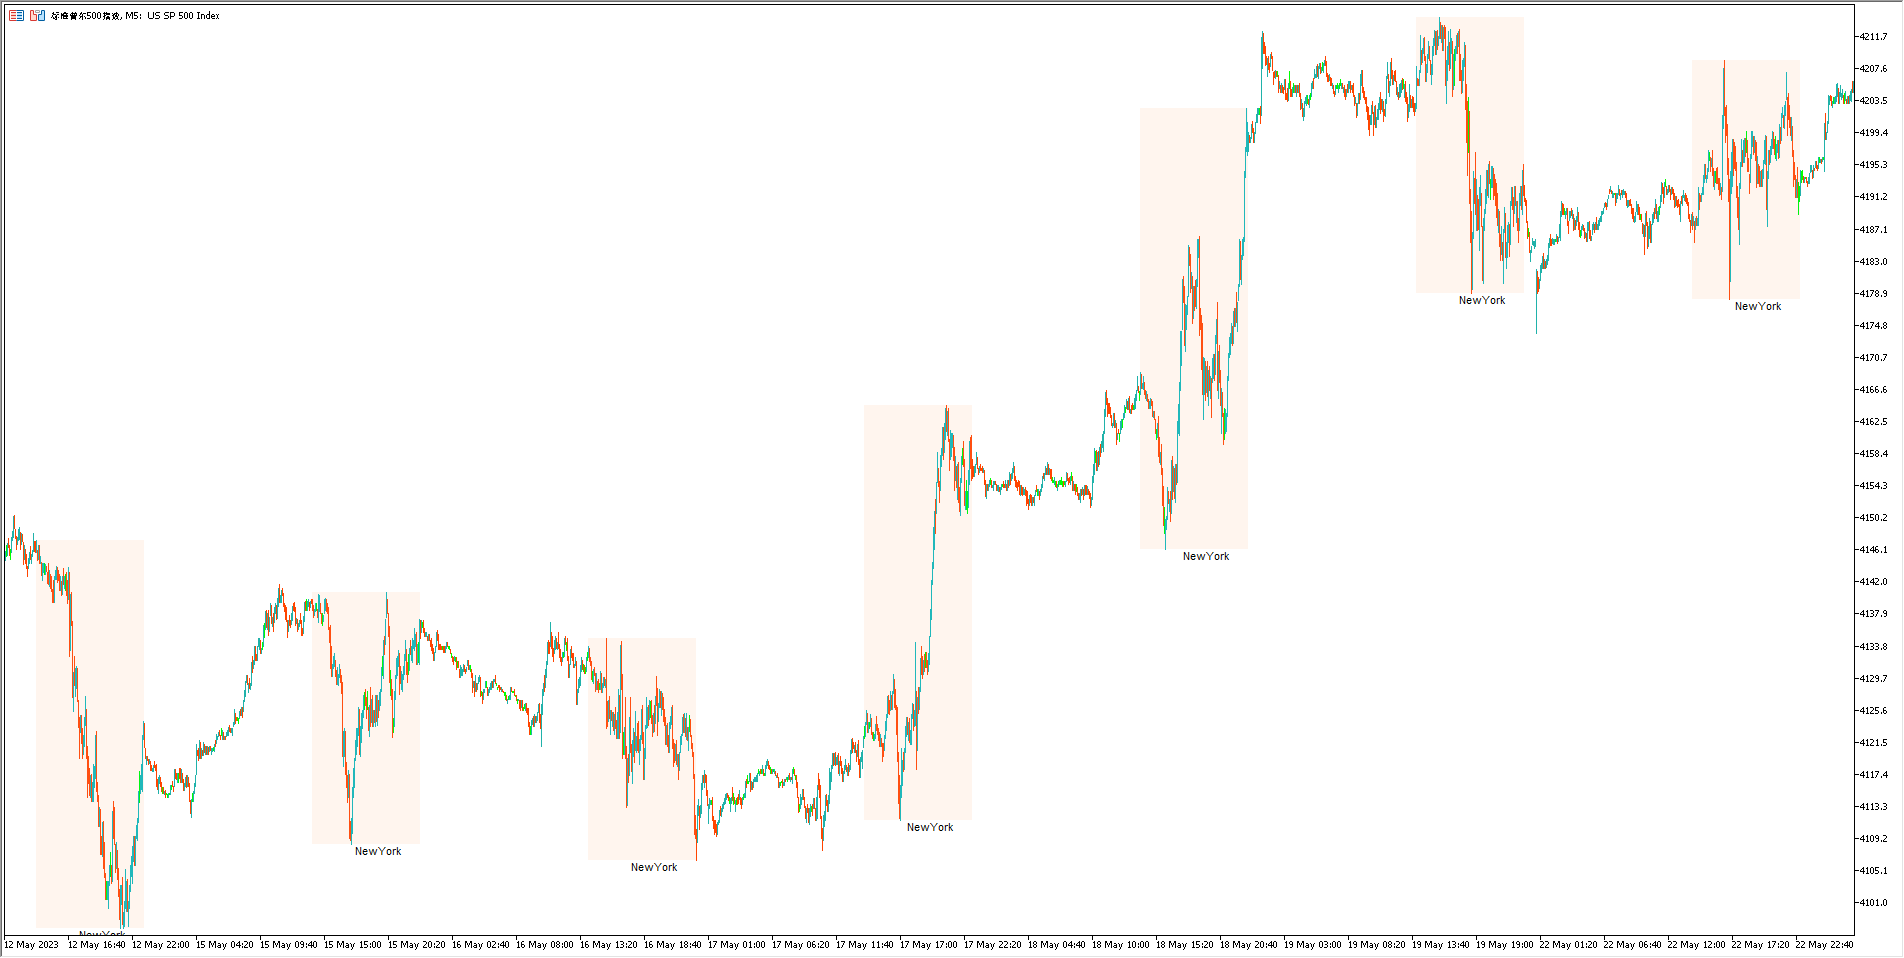
该指标显示亚洲、伦敦和纽约市场的交易时间。用户可以设置显示或隐藏不同的交易时区,以便更方便地使用。此外,该指标可以根据设置显示或隐藏交易会话的名称,并限制最大显示数量。
实际使用过程非常简单:一旦您购买了该指标,将指标文件复制到您的MetaTrader 5平台的指标文件夹中,在MetaTrader 5平台中打开您想要应用指标的图表,从指标列表中选择指标,并将其拖放到您的图表上。
一旦指标成功应用,您将看到一个包含亚洲、伦敦和纽约市场交易时间的表格。您可以根据个性化设置显示或隐藏不同的交易时区,以更好地了解市场情况。同时,您还可以根据个性化设置显示或隐藏交易会话的名称,并限制最大显示数量。
该指标还提供多个可自定义选项,供您根据需要进行设置。您可以选择不同的颜色表示多个交易时区,并选择是否显示交易会话的名称。此外,您可以限制最大显示数量,以更好地管理您的图表。
因此,这个交易会话指标是一个非常实用的工具,可以帮助交易者全面了解市场情况,并更好地制定交易策略。如果您是交易者,我强烈建议您尝试使用这个指标,并将其应用于您的交易策略中,以实现更好的交易结果。
如果您对此指标有兴趣,您也许会对我所提供的更为高级的指标感兴趣。
Easy ICT Price Action 点击这里:MT5版本
Easy ICT Price Action 点击这里:MT4版本


good job