• 概述
  • 评论
  • 评论
  • 新特性

COG Signal AM

The product is based on J.F. Ehlers' Center of Gravity indicator.

Center of Gravity actually has a zero lag and allows to define turning points precisely.

The indicator is a result of Ehlers' research of adaptive filters.

It identifies main pivot points almost without any lag. 

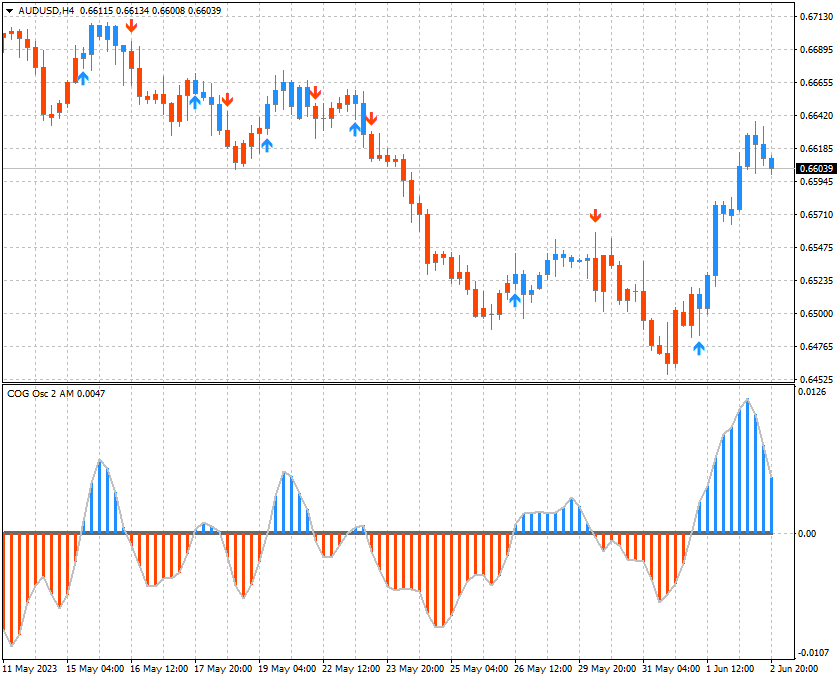
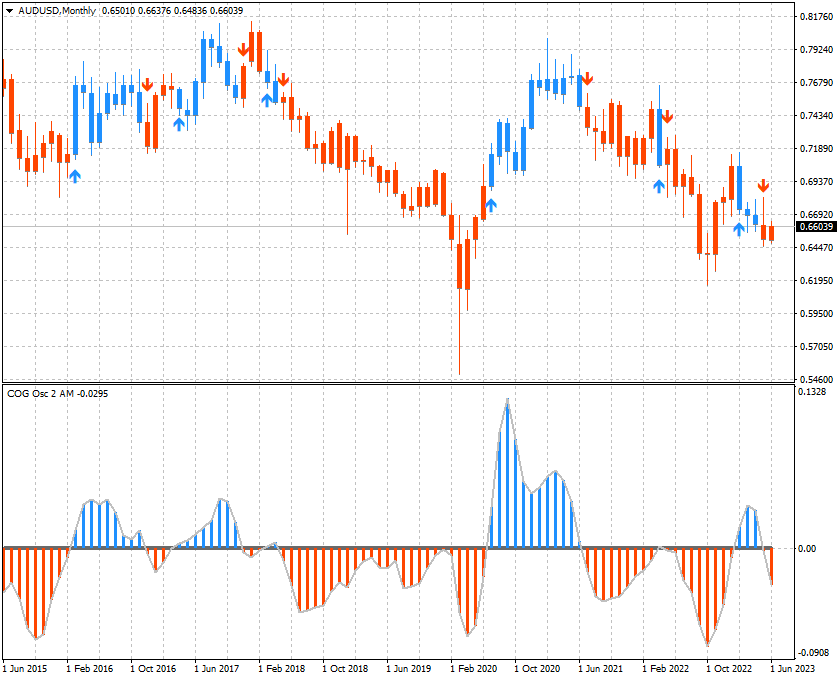
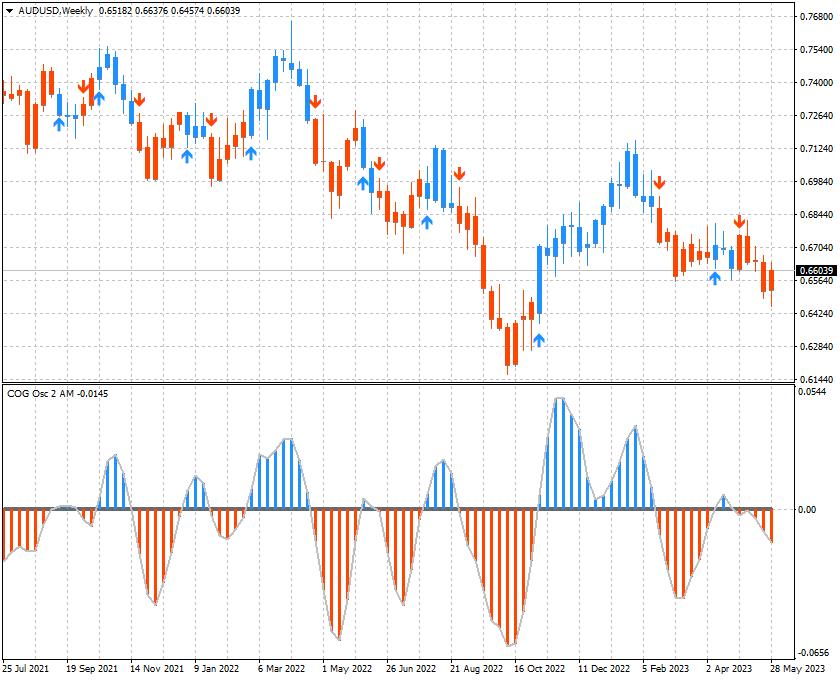
The indicator places signals on the price chart according to COG data.

The indicator does not repaint.


Parameters:
  • Length - indicator calculation period;
  • MaPrice - price used to calculate the indicator;
  • Signal - indicator display options;

  • Distance - the parameter that determines how close to the price value the indicator signal will be displayed on the price chart;
  • Alerts - displays a dialog box containing user data;
  • Send_Mail - sends an email to the address specified in the settings window on the "Mail" tab;
  • Send_Notification - sends a notification to mobile terminals whose MetaQuotes IDs are specified in the settings window on the "Notifications" tab.


    推荐产品
    Signals and Alerts for Accelerator/Decelerator indicator based on these MQL5 posts: Accelerator Oscillator and Signals of the Indicator Accelerator Oscillator . Note : this tool is based on the code of Accelerator indicator developed by MetaQuotes Software Corp. Features The signals are triggered at   closing   of last bar/opening of a new bar; Any kind of alerts can be enabled: Dialog Box, Email message, SMS notifications for smartphones and tablets, and Sound alerts; Customizable arrows. By
    FREE
    COG Osc 2 AM
    Andriy Matviyevs'kyy
    The product is based on J.F. Ehlers' Center of Gravity indicator. Center of Gravity actually has a zero lag and allows to define turning points precisely. The indicator is a result of Ehlers' research of adaptive filters. It identifies main pivot points almost without any lag.  The indicator displays the COG oscillator in a separate window. Parameters: Length - indicator calculation period. MaPrice - price used to calculate the indicator. Signal - indicator display options. The indicator does
    FREE
    MACD in MA
    Nikolaos Pantzos
    iMACD in iMA is indicator to change color in iMA if iMACD is upper of zero (up trend) or lower of zero (down trend). It is a useful tool to track when the upside and the downside iMACD on iMA. You can to get source code from here . Parameters MA_Periods — Period for iMA. MA_Method — Method for iMA. MACD_FastEMA — Fast EMA for MACD. MACD_SlowEMA — Slow EMA for MACD. MACD_SignalSMA — SMA signal for MACD. MACD_ApliedPrice — Price used for MACD. BarsCount — How many bars will show the line. Reve
    FREE
    MACD Max Free
    John Louis Fernando Diamante
    5 (1)
    A flexible 2-Line MACD indicator The default MACD indicator inside MT4, limits you to using the MACD with a fast-EMA, slow-EMA, and signal-SMA. This MACD indicator allows you to set your own MA-Method choices for these 3 components, separately! You can select from SMA-EMA-SMMA-LWMA, and can even use a separate method for each 3 fast-slow-signal periods. A more featured version is available with colored candles+conditions, full alerts+conditions, line coloring, DEMA and TEMA options; MACD MAX
    FREE
    Donchian Trend Histogram
    Mariusz Piotr Rodacki
    Donchian channels are a tool in technical analysis used to determine the relative volatility of a market and the potential for price breakouts. Can help identify potential breakouts and reversals in price, which are the moments when traders are called on to make strategic decisions. These strategies can help you capitalize on price trends while having pre-defined entry and exit points to secure gains or limit losses. Using the Donchian channel can thus be part of a disciplined approach to manag
    FREE
    Line on Osc AM
    Andriy Matviyevs'kyy
    5 (1)
    This indicator combines the best features of a trend indicator and an oscillator. Effective trend detection and short-term price fluctuations. Operating principle: The indicator analyzes price direction using one of many standard oscillators. If the oscillator indicates a change in the direction of price movement, the indicator signals this by placing a small arrow on the chart opposite the bar on which the oscillator gave the corresponding signal. At the same time, the main signal of the indi
    FREE
    Hull Signal AM
    Andriy Matviyevs'kyy
    The presented indicator marks signals on the price chart with arrows in accordance with the data of the Hull Momentum AM indicator. The indicator gives a signal and sends a notification to the mobile terminal and email. The indicator is part of a series of indicators -  Hull Line AM, Hull Momentum AM, Hull Candles AM, Hull Signal AM . For a better understanding of the operation of each of the indicators, it is recommended to start working with them by using them together on one chart. The Hull M
    FREE
    COG Candles 2 AM
    Andriy Matviyevs'kyy
    The product is based on J.F. Ehlers' Center of Gravity indicator. Center of Gravity actually has a zero lag and allows to define turning points precisely. The indicator is a result of Ehlers' research of adaptive filters. It identifies main pivot points almost without any lag.  The indicator colors candlesticks in accordance with COG data. Parameters: Length - indicator calculation period. MaPrice - price used to calculate the indicator. Signal - indicator display options. The indicator does n
    FREE
    Crossover MA Histogram
    Mariusz Piotr Rodacki
    The Cossover MA Histogram indicator is a simple tool showing the trend based on crossover of moving averages. Simply specify two mobving averages and addicional parameters like MA method and Applied price. When fast MA is above slow MA the histogram is green, indicating an uptrend. When MA fast is below MA slow the histogram is red, indicating an downtrend.
    FREE
    Shooter AM
    Andriy Matviyevs'kyy
    This indicator is an implementation of the "One shot - one hit" principle. In the course of work on the creation of this product, an attempt was made to achieve the maximum balance between the sensitivity of the indicator and the effectiveness of its signals. This tool is as reliable and effective as a 45 caliber revolver, but in the same way it requires discipline and understanding of the conditions and purpose of use from its user. The indicator has only one adjustable parameter that determine
    FREE
    Shooter 2 AM
    Andriy Matviyevs'kyy
    This indicator is an implementation of the "One shot - one hit" principle. In the course of work on the creation of this product, an attempt was made to achieve the maximum balance between the sensitivity of the indicator and the effectiveness of its signals. This tool is as reliable and effective as a 45 caliber revolver, but in the same way it requires discipline and understanding of the conditions and purpose of use from its user. The indicator has only one adjustable parameter that determine
    FREE
    SuperTrend V
    Muhammad Hassaan
    5 (1)
    *This is TradingView indicator converted to mql4* The SuperTrend V indicator is a popular technical analysis tool used to identify trends and potential trend reversals in financial markets. It is based on the concept of the SuperTrend indicator but incorporates additional features and variations. The SuperTrend V indicator uses a combination of price action and volatility to determine the trend direction and generate trading signals. Here are the key components and features of the indicator:
    FREE
    Wise Men Indicator demo
    Bohdan Kasyanenko
    3.67 (3)
    The indicator displays signals according to the strategy of Bill Williams on the chart. Demo version of the indicator has the same features as the paid, except that it can work only on a demo account . Signal "First Wise Man" is formed when there is a divergent bar with angulation.  Bullish divergent bar - with lower minimum and closing price in the upper half. Bearish divergent bar - higher maximum and the closing price at the bottom half. Angulation is formed when all three lines of Alligat
    FREE
    Download the free USDJPY version   here. MACD Indicator The Moving Average Convergence and Divergence (MACD) is a trend following momentum indicator which shows the relationship between two moving averages that we chose and configure them on the indicator. The MACD is calculated by subtracting the 26-period exponential moving average and the 12 period D.A.M. These are the default parameters when you put the MACD indicator on the charts, and the period is usually 9 which means the last 9 candle
    FREE
    PZ The Zone
    PZ TRADING SLU
    4.25 (4)
    This indicator displays buy or sell signals according to Bill Williams' definition of the Trading Zone. [ Installation Guide | Update Guide | Troubleshooting | FAQ | All Products ] Easy to use and understand Avoid trading flat markets Deterministic indicator with clear rules The indicator is non-repainting It implements alerts of all kinds It has straightforward trading implications. A blue arrow is a buy signal A red arrow is a sell signal According to Bill Williams trading in the zone helps to
    FREE
    KeltnerChannelIndicator
    Todd Terence Bates
    5 (1)
    The Keltner Channel is a volatility-based technical indicator composed of three separate lines. The middle line is an exponential moving average (EMA) of the price. Additional lines are placed above and below the EMA. The upper band is typically set two times the Average True Range (ATR) above the EMA, and the lower band is typically set two times the ATR below the EMA. The bands expand and contract as volatility (measured by ATR) expands and contracts. Since most price action will be encompasse
    FREE
    Introducing the Consecutive Green/Red Candle Alert Indicator for MT4 - Your Trend Spotting Companion! Are you ready to take your trading to the next level? We present the Consecutive Green/Red Candle Alert Indicator, a powerful tool designed to help you spot trends and potential reversals with ease. Whether you're a new trader looking for clarity in the market or an experienced pro seeking additional confirmation, this indicator is your trusted companion. Key Features of the Consecutive Green/Re
    FREE
    MACD Currency Meter
    Emir Revolledo
    4.88 (81)
    MACD shì zuì shòu huānyíng de dòngliàng hé qūshì zhǐbiāo zhī yī. Huòbì qiángdù jì yěshì jīyú duō zhǒng huòbì de qūshì zhǐbiāo. MACD huòbì qiángdù jì shì jùyǒu MACD hé huòbì qiángdù jìsuàn fǎ de dān túbiǎo zhǐbiāo. Tā hái jùyǒu yī jiàn shì gōngnéng, qízhōng 28 gè zhǔyào hé cì yào duì xiǎnshì zài nín de yíbiǎo bǎn shàng, tōngguò dān jī mǒu gè duì, nín de túbiǎo jiāng zìdòng gēnggǎi wèi nín xuǎnzé de túbiǎo. Chǎnpǐn yōushì lùzhì de guānyú rúhé shǐyòng zhǐbiāo dì wǎngluò yántǎo huì wánzhěng de zījī
    Stochastic Arrow
    Anton Iudakov
    4.6 (5)
    The indicator has combined 5 popular strategies. Draws an arrow after confirming a signal for the selected strategy. There are signal alerts. Doesn't redraw its values. I recommend watching my advisor -   Night Zen EA 5 strategies. The main line crosses the signal line. The main line crosses the signal line in the oversold (for buy) / overbought (for sell) zones. The main line enters the oversold (for sell) / overbought (for buy) zones . The main line comes out of the oversold (for buy ) / ove
    FREE
    ChannelRSI4
    Iurii Tokman
    5 (2)
    ChannelRSI4   具有超买和超卖区域动态水平的相对强弱指数 (RSI) 指标。 动态水平随指标和价格的当前变化而变化和调整,代表一种通道。 指标设置 period_RSI - 计算 RSI 指数的平均周期。 Applied_RSI - 应用价格。它可以是任何价格常数:PRICE_CLOSE - 收盘价,PRICE_OPEN - 开盘价,PRICE_HIGH - 期间的最高价,PRICE_LOW - 期间的最低价,PRICE_MEDIAN - 中间价(高 + 低) / 2, PRICE_TYPICAL - 典型价格(最高价 + 最低价 + 收盘价)/ 3, PRICE_WEIGHTED - 加权平均价,(最高价 + 最低价 + 收盘价 + 收盘价)/ 4。 period_channel - 超买超卖区域动态通道的计算周期。
    FREE
    This indicator is the basis for an Expert Advisor that can be categorized as "almost Grail". See details below.             This indicator displays the projection of the Renko chart on the price chart. This projection is displayed as a stepped line, not as "bricks" (rectangles). See slides 1 and 2. Abbreviated name of the indicator: LRC – L ine of R enko on the price C hart.             The principle of its construction is very simple. First, a grid of horizontal lines (levels) is bu
    FREE
    一个专业的交易工具是RSI和价格之间的背离指标,它允许您及时收到关于趋势反转的信号或捕捉价格回调走势(取决于设置)。 指标设置允许您根据RSI峰值的角度和价格的百分比变化来调整发散的强度,这使得微调信号强度成为可能。 指标代码经过优化,并作为Ea交易的一部分进行了非常快速的测试。  指标不重绘,交易方向的箭头正好位于信号出现的位置--在柱的开口处。 PeriodRSI_P     = 14 ;   //Period IndentFrom50_P  = 20.0 ; //Indent +- from 50 [0...50] LeftBars_P      = 1 ;     //LeftBars RightBars_P     = 1 ;     //RightBars IndDivForce_P   = 55.0 ; //Divergences force of indicator PriceDivForce_P = 0.01 ; //Divergences force of price Price_P         = PRICE_CLOSE ; //Price type
    FREE
    RSI Divergence F MT4
    Andrey Dik
    4.67 (3)
    一个专业的交易工具是RSI和价格之间的背离指标,它允许您及时收到关于趋势反转的信号或捕捉价格回调走势(取决于设置)。 指标设置允许您根据RSI峰值的角度和价格的百分比变化来调整发散的强度,这使得微调信号强度成为可能。 指标代码经过优化,并作为Ea交易的一部分进行了非常快速的测试。  指标不重绘,交易方向的箭头正好位于信号出现的位置--在柱的开口处。 Fractal True PeriodRSI_P     = 14 ;   //Period IndentFrom50_P  = 20.0 ; //Indent +- from 50 [0...50] LeftBars_P      = 1 ;     //LeftBars RightBars_P     = 1 ;     //RightBars IndDivForce_P   = 55.0 ; //Divergences force of indicator (not for the Lite version) PriceDivForce_P = 0.01 ; //Divergences force of price (not f
    FREE
    TSO Stochastic RSI
    Dionisis Nikolopoulos
    3.71 (7)
    Stochastic RSI makes a stochastic calculation on the RSI indicator. The Relative Strength Index (RSI) is a well known momentum oscillator that measures the speed and change of price movements, developed by J. Welles Wilder. Features Find overbought and oversold situations. Sound alert when overbought/oversold level is reached. Get email and/or push notification alerts when a signal is detected. The indicator is non-repainting. Returns buffer values for %K and %D to be used as part of an EA . (
    FREE
    T3 Signal AM
    Andriy Matviyevs'kyy
    The presented indicator marks signals on the price chart with arrows in accordance with the data of the  T3 Momentum AM  indicator. The indicator gives a signal and sends a notification to the mobile terminal and email. The indicator is part of a series of indicators - T3 Line AM, T3 Momentum AM, T3 Candles AM, T3 Signal AM . For a better understanding of the operation of each of the indicators, it is recommended to start working with them by using them together on one chart. The T3 Momentum AM
    FREE
    RelicusRoad MACD v2
    Relicus LLC
    4.67 (6)
    移动平均收敛发散(MACD)交易策略是一种流行的技术分析工具,用于识别动量和趋势方向的变化。MACD的计算方法是将26期指数移动平均线(EMA)减去12期EMA。然后在MACD上方绘制一个9期EMA,称为“信号线”,以充当买入和卖出信号的触发器。 当MACD线在信号线上方时,MACD被认为处于看涨区域,在下方时处于看跌区域。交易者经常使用这些信息来确定潜在的买入和卖出机会。 MACD是一种多功能指标,可以用多种方式使用,其中一些常见的用法包括: 交叉:当MACD线穿过信号线时,出现看涨交叉;当MACD线穿过信号线下方时,出现看跌交叉。 发散:当MACD正在创造新高时,而基础证券没有创造新高时,出现看涨发散;当MACD正在创造新低时,而基础证券没有创造新低时,出现看跌发散。 趋势跟踪:当MACD在零线上方时,出现看涨趋势;当MACD在零线下方时,出现看跌趋势。 需要注意的是,MACD是一种滞后指标,应与其他技术指标和分析结合使用才能做出交易决策。
    FREE
    Follow The Line
    Oliver Gideon Amofa Appiah
    4 (13)
    FOLLOW THE LINE GET THE FULL VERSION HERE: https://www.mql5.com/en/market/product/36024 This indicator obeys the popular maxim that: "THE TREND IS YOUR FRIEND" It paints a GREEN line for BUY and also paints a RED line for SELL.  It gives alarms and alerts of all kinds. IT DOES NOT REPAINT and can be used for all currency pairs and timeframes. Yes, as easy and simple as that. Even a newbie can use it to make great and reliable trades. NB: For best results, get my other premium indicators for more
    FREE
    Trend Extremums
    Luc Michael Botes
    5 (1)
    Description:  This indicator (with its algorithm) marks relative highs and lows, which have an array of useful applications.  This indicator will never repaint.  Features:  Marks relative highs and lows  Use this to determine points of trend continuation i.e. where the trend may pull back before continuing higher or lower, past this point Or use this to determine potential points of reversal, particularly in ranging markets, or with other price action  These highs and lows can sometimes
    FREE
    OsMA Arrow MTF
    Pavel Shutovskiy
    3.92 (12)
    The indicator displays crossing zero level by Moving Average of Oscillator (OsMA) in the form of arrows. The this is a multi-timeframe indicator, and it displays signals from other timeframes. The indicator notifies about a signal by means of a pop-up Alert window, or sending notification to e-mail. Parameters Time-frame - select timeframe to show indicator signals. Fast EMA Period - fast EMA. This is an exponential moving average from a price with a short period. Slow EMA Period - slow EMA. T
    FREE
    Free automatic fibonacci
    Tonny Obare
    4.65 (62)
    Free automatic Fibonacci is an indicator that automatically plots a Fibonacci retracement based on the number of bars you select on the BarsToScan setting in the indicator. The Fibonacci is automatically updated in real time as new highest and lowest values appears amongst the selected bars. You can select which level values to be displayed in the indicator settings. You can also select the color of the levels thus enabling the trader to be able to attach the indicator several times with differe
    FREE
    该产品的买家也购买
    Gann Made Easy
    Oleg Rodin
    4.93 (72)
    Gann Made Easy 是一个专业且易于使用的外汇交易系统,它基于使用先生理论的最佳交易原则。 W.D.江恩。该指标提供准确的买入和卖出信号,包括止损和获利水平。您甚至可以使用推送通知在旅途中进行交易。 购买后请联系我!我将免费与您分享我的交易技巧和丰厚的红利指标! 您可能已经多次听说过江恩交易方法。通常 Gann 的理论不仅对于新手交易者而且对于那些已经有一定交易经验的人来说都是非常复杂的东西。这是因为江恩的交易方法在理论上并不那么容易应用。我花了几年时间来完善这些知识,并将最好的原则应用到我的外汇指标中。 该指标非常易于应用。您所需要的只是将其附加到您的图表并遵循简单的交易建议。该指标不断进行市场分析工作并寻找交易机会。当它检测到一个好的入口点时,它会为您提供一个箭头信号。该指标还显示止损和获利水平。 换句话说,当您像先生一样进行交易时,该指标会为您提供最佳江恩建议。江恩亲自告诉你此时此刻该做什么。但最好的部分是您不需要了解任何有关江恩交易原则的知识,因为该指标会为您完成整个市场分析工作。
    Advanced Currency Strength28 Indicator
    Bernhard Schweigert
    4.9 (663)
    目前26%的折扣 任何新手或专家交易者的最佳解决方案! 这个指标是一个独特的、高质量的、可负担得起的交易工具,因为我们纳入了一些专有的功能和一个新的公式。只需一个图表,你就可以读出28个外汇对的货币强度!想象一下,你的交易将如何得到改善,因为你的交易是在你的手中进行的。想象一下,你的交易将如何改善,因为你能够准确地确定新趋势或剥头皮机会的触发点? 用户手册:点击这里  https://www.mql5.com/en/blogs/post/697384 这是第一本,原版的! 不要买一个毫无价值的崇拜者的克隆品。 特别的 子窗口中的箭头显示强劲的货币势头GAP将指导你的交易! 当基础货币或报价货币处于超卖/超买区域(外盘斐波那契水平)时,在个人图表的主窗口中出现警告信号。 当货币力量从外围区间回落时,回撤/反转警报。 十字星模式的特别警报 可选择多个时间框架,以快速查看趋势! 货币强度线在所有的时间框架中都非常平稳,当使用较高的时间框架来识别总体趋势,然后使用较短的时间框架来确定精确的入口时,效果非常好。你可以根据自己的意愿选择任何时间框架。每个时间框架都由其自身进
    Trend Punch
    Mohamed Hassan
    5 (10)
    Manual guide:   Click here PROMO of  $79 for 2 copies left!  -- Next price is  $149 .  This indicator is unstoppable when combined with our other indicator called  Support & Resistance . After purchase, send us a message and you will get it   for  FREE as a BONUS! I like to use Trend Punch on XAUUSD & BTCUSD on the M1 timeframe!  Introducing Trend Punch , the revolutionary forex trend indicator that will transform the way you trade! Trend Punch is uniquely designed to provide preci
    Atomic Analyst
    Issam Kassas
    5 (3)
    首先值得强调的是,该交易指标是非重绘、非延迟的指标,这使其成为手动和机器人交易的理想选择。 用户手册:设置、输入和策略。 Atomic Analyst是一种PA价格行动指标,利用价格的力量和动量来寻找市场上更好的机会。配备了高级过滤器,可帮助去除噪音和假信号,并提高交易潜力。使用多层复杂的指标,Atomic Analyst扫描图表,并将复杂的数学计算转化为任何初学者都能理解并用来做出一致交易决策的简单信号和颜色。 “Atomic Analyst”是专为新手和经验丰富的交易者量身定制的综合交易解决方案。它将高级指标和一流功能融合为一体的交易策略,使其成为所有类型交易者的多功能选择。 日内交易和剥头皮策略:专为快速准确的日内交易和短期交易而设计。 日内和摆动交易策略:可用作追求价格大幅波动的日内和摆动交易者的可靠工具。 多货币和市场:凭借其可靠的精度,在不同的工具和市场上运作。 多个时间框架:可在多个时间框架上使用,性能良好。 稳定性:所有指标均不重绘、不重绘和不滞后,确保可靠的信号。 信号清晰度:提供箭头信号,用于清晰的入场和出场点。 实时警报:通过交易入场、SL和TP警报通知交
    TPSpro RFI Levels
    Roman Podpora
    4.82 (17)
    Reversal First Impulse levels (RFI)    INSTRUCTIONS        RUS       -       ENG              R ecommended to use with an indicator   -   TREND PRO -  Version MT5 A key element in trading is zones or levels from which decisions to buy or sell a trading instrument are made. Despite attempts by major players to conceal their presence in the market, they inevitably leave traces. Our task was to learn how to identify these traces and interpret them correctly. Main functions: Displaying active zones
    Scalper Inside PRO
    Alexey Minkov
    4.74 (58)
    An exclusive indicator that utilizes an innovative algorithm to swiftly and accurately determine the market trend. The indicator automatically calculates opening, closing, and profit levels, providing detailed trading statistics. With these features, you can choose the most appropriate trading instrument for the current market conditions. Additionally, you can easily integrate your own arrow indicators into Scalper Inside Pro to quickly evaluate their statistics and profitability. Scalper Inside
    Market Reversal Alerts
    LEE SAMSON
    4.21 (121)
    成為突破者,隨著價格反轉,市場結構會改變利潤。 訂單突破者指示器可以識別趨勢或價格走勢何時接近枯竭並準備好逆轉。它會提醒您市場結構的變化,通常會在發生逆轉或重大回調時發生。 該指標使用專有計算來確定突破和價格動能。每當在可能的耗盡點附近形成新的高點時,指標就會繪製最後一個生成該高點的順序塊。然後,它將隨價格移動隨價格跟隨定單。然後,當價格轉向相反方向並突破該訂單塊時,它會提醒您,從而創建新的市場結構並開始趨勢或重大回調的可能逆轉。 訂單塊是在創建高/低之前的最後一個相反的彩色蠟燭,並且當價格跌破這些關鍵區域以下時,這表明趨勢可能會發生短期或長期反轉。 特徵 提醒您關鍵耗盡點的市場結構變化 價格接近耗盡水平時自動提取訂單塊 在一個方向繼續移動時,在價格後面跟踪定單,以提醒您最佳的反轉輸入 將顏色更改為純色塊,以顯示何時發生市場結構中斷。 適用於所有交易品種和時間範圍 內置集成的彈出窗口和電子郵件警報 策略和如何與定單破壞者指標進行交易 當斷路器塊發生時,您有兩個選擇。 看左邊!我們正在尋求供應/需求或支撐/阻力位嗎?市場結構轉變(逆轉)通常發生在價格重新測試舊水平或
    Advanced Supply Demand
    Bernhard Schweigert
    4.92 (312)
    现在优惠 33%! 任何新手或专业交易者的最佳解决方案! 该指标是一款独特、高质量、且价格合理的交易工具,因为我们已经整合了许多专有功能和新公式。 依据此更新,您将能够显示双重时间帧区域。 您不仅可以显示一个较高的时间帧,还可以同时显示图表时间帧,加上更高的时间帧:显示嵌套时区。 供需双方所有交易者都会喜欢它。 :) 重要信息披露 高级供需的最大潜力,请访问 https://www.mql5.com/zh/blogs/post/720245   想象您的交易如何得以改善,是因为您能够精准定位入场或目标位吗? 构建于新的底层算法,它可以更轻松地识别出买卖双方之间的潜在失衡。 这是因为它以图形方式展示供需最强劲区域,及其过去的表现(显示旧区域)。 这些功能旨在帮助您更轻松地发现最佳入场区域和价位。 现在您可以针对您的交易品种和时间帧来优化和编辑区域强度! 高级供需指标适用于所有产品和时间帧。 它是一个新的公式,非常新的功能是两个区域强度函数可由用户输入进行调整! 这在交易中是一大优势。 当您学习如何使用专有功能,例如带有价格游离最小 X 因子的区域强度时,您能够判断该区域强劲与否。 供
    Gold Stuff
    Vasiliy Strukov
    4.89 (259)
    Gold Stuff 是专为黄金设计的趋势指标,也可用于任何金融工具。 该指标不会重绘,也不会滞后。 推荐时间框架 H1。 在它指标工作全自动专家顾问 EA Gold Stuff。 你可以在我的个人资料中找到它。 重要! 购买后立即与我联系,以获得说明和奖金!   您可以免费收到我们的强力支持和趋势扫描指标的副本,请私信。大部头书! 购买后立即联系我以获得设置和个人奖励!   设置 绘制箭头 - 打开关闭。 在图表上绘制箭头。 警报 - 打开关闭声音警报。 电子邮件通知 - 打开关闭。 电子邮件通知。 Puch-notification - 打开关闭。 推送通知。 接下来,调整色域。 Gold Stuff 是专为黄金设计的趋势指标,也可用于任何金融工具。 该指标不会重绘,也不会滞后。 推荐时间框架 H1。 在它指标工作全自动专家顾问 EA Gold Stuff。 你可以在我的个人资料中找到它。 购买后立即联系我以获得设置和个人奖励!   设置 绘制箭头 - 打开关闭。 在图表上绘制箭头。 警报 - 打开关闭声音警报。 电子邮件通知 - 打开关闭。 电子邮件通
    目前八折优惠! 对任何新手或专家交易者来说都是最好的解决方案! 这个仪表板软件适用于28种货币对。它基于我们的两个主要指标(高级货币强度28和高级货币冲动)。它对整个外汇市场提供了一个伟大的概述。它显示高级货币强度值,货币运动速度和28个外汇对在所有(9)时间段的信号。想象一下,当你可以使用图表上的单一指标观察整个市场,以确定趋势和或剥头皮的机会时,你的交易将得到改善 我们已经在这个指标中建立了一些功能,使你更容易识别强势和弱势货币,同时识别和确认潜在的交易。该指标以图形方式显示货币的强势或弱势是增加还是减少,以及它在所有时间段的表现。 增加的新功能是动态市场斐波那契水平,它适应当前的市场条件变化,这是一个已经在我们的高级货币强度28和高级货币冲动指标中使用的成熟的加分项。 在交易时,总是将弱势货币和强势货币配对,这个新指标将帮助你做到这一点。 用户手册:点击这里  https://www.mql5.com/en/blogs/post/708783 特点  显示每个时间段的ACS28和GAP-speed(冲动)的货币强度值。 列:颜色代码以7种颜色
    TPSproTREND PrO
    Roman Podpora
    4.78 (18)
    TPSpro TRENDPRO  - is a trend indicator that automatically analyzes the market and provides information about the trend and each of its changes, as well as giving signals for entering trades without redrawing! The indicator uses each candle, analyzing them separately. referring to different impulses - up or down impulse. Exact entry points into transactions for currencies, crypto, metals, stocks, indices!  -  Version MT5               DETAILED DESCRIPTION                R ecommended to use with
    Legacy of Gann
    Pavel Zamoshnikov
    4.83 (12)
    The indicator very accurately determines the levels of the possible end of the trend and profit fixing. The method of determining levels is based on the ideas of W.D.Gann, using an algorithm developed by his follower Kirill Borovsky. Extremely high reliability of reaching levels (according to K. Borovsky  - 80-90%) Indispensable for any trading strategy – every trader needs to determine the exit point from the market! Precisely determines targets on any timeframes and any instruments (forex, met
    FX Volume
    Daniel Stein
    4.6 (35)
    通过 mql5 和 Telegram 上 的 " 晨间简报 "获取每日市场更新,包括详细信息和屏幕截图 ! 外汇交易量(FX Volume)是第一个也是唯一一个从经纪商角度真正洞察市场情绪的交易量指标。 直接在您的图表上看到这些信息是真正改变游戏规则和突破性的交易解决方案。 受益于独特的市场数据洞察,如 比率(Ratios )显示货币多头和空头头寸的比率(百分比 比率变化 显示所选时间段内的多头比率及其百分比变化 总交易量 显示货币的总交易量(多头和空头),以手为单位 多头 交易量显示货币所有多头头寸的交易量 空头 交易量显示所有货币空头头寸的交易量 净多头 显示净多头交易量,即所有多头头寸减去所有空头头寸(以手为单位)。 净多头百分比 显示货币净多头交易量的变化 请阅读我们的基本教程 -> "如何使用外汇交易量进行交易 " 获取更多信息,如常见问题、交易技巧和教程视频,请访问我们的 外汇交易量公共信息频道 请 安装并运行 SI Connect 以建立与我们数据中心的持续连接 背景信息 我们都知道,外汇是一个分散的市场。这就是为什么我们必须打破常规思维,开发一个独
    FX Power MT4 NG
    Daniel Stein
    5 (10)
    通过 mql5 和 Telegram 上 的晨间简报获取每日市场更新,包括详细信息和屏幕截图 ! FX Power MT4 NG 是我们长期以来非常受欢迎的货币强度计算器 FX Power 的下一代产品。 这款下一代强度计算器能提供什么?您所喜爱的原版 FX Power 的所有功能 附加功能 黄金/XAU 强度分析 更精确的计算结果 可单独配置的分析周期 可自定义计算限制,以获得更好的性能 为希望查看更多信息的用户提供特殊的多实例设置 无尽的图形设置,可在每个图表中设置您最喜欢的颜色 无数的通知选项,让您再也不会错过任何重要信息 采用 Windows 11 和 macOS 风格的全新圆角设计 神奇的移动指标面板 FX Power 主要功能 所有主要货币的完整强势历史 所有时间框架内的货币强弱历史 所有经纪商和图表的计算结果完全相同 100% 可靠的实时计算 -> 无重绘 可通过下拉列表选择分析时段 通过自定义模式单独配置分析时段 可在一个图表中使用多个实例 可移动 FX Power 显示屏(通过拖放) 适用于高分辨率 QHD、UHD 和 4K 显示器 自动终端配置 针对平板电脑
    Enigmera
    Ivan Stefanov
    5 (2)
    ENIGMERA:市场核心 https://www.enigmera.com 简介 该指标和交易系统是金融市场的一种非凡方法。ENIGMERA 利用分形周期精确计算支撑位和阻力位。它能显示真实的累积阶段,并给出方向和目标。 该系统无论在趋势中还是在修正中都能发挥作用。 它是如何运行的? ENIGMERA 由三条线组成:支撑/阻力线、目标线和偏离线。与一般市场指标将过去的数据推断为现在和未来的情况不同,该系统能提供当前的完整情况。如果你处于支撑位,这意味着真正的支撑;如果你处于阻力位,这意味着真正的阻力。如果突破某一水平,则表示趋势发生变化。没有重绘。 由于市场在不断变化,ENIGMERA 不断调整其评估工具,定期修改策略。  这保证了每种情况都能得到全面评估。这一市场指标的独特性显而易见,其能力不言而喻。  ENIGMERA 为金融分析师和咨询师提供服务,他们需要可靠的见解与客户分享,也为投资者提供服务,他们需要最精确和最可靠的保证。 该系统能够达到最佳精度,使交易者能够自信、清晰地评估他们的选择。 ENIGMERA 将 20 年的交易专长和知识整合到一个综合软件
    首先,值得强调的是,这个交易工具是非重绘、非重画和非滞后的指标,非常适合专业交易。 在线课程,用户手册和演示。 智能价格行动概念指标是一个非常强大的工具,既适用于新手,也适用于经验丰富的交易者。它将超过20个有用的指标合并到一个指标中,结合了高级交易思想,如内圈交易员分析和智能资金概念交易策略。该指标侧重于智能资金概念,提供有关大型机构交易方式的见解,帮助预测它们的动向。 它在流动性分析方面尤其擅长,有助于理解机构的交易方式。它擅长预测市场趋势,并仔细分析价格波动。通过将您的交易与机构策略对齐,您可以更准确地预测市场走向。该指标多才多艺,擅长分析市场结构,识别重要的订单区块,并识别各种模式。 它擅长识别BOS和CHoCH等模式,理解动量的转变,并突出显示供需强劲的关键区域。它还擅长发现强大的不平衡,并分析价格创造更高高点或更低低点的模式。如果您使用斐波那契回撤工具,该指标可以满足您的需求。它还可以识别相等的高点和低点,分析不同的时间框架,并通过仪表板显示数据。 对于使用更高级策略的交易者,该指标提供了工具,如公平价值差指标和优惠和折扣区域的识别。它特别关注高时间框架订单
    Auto Order Block with break of structure based on ICT and Smart Money Concepts (SMC) Futures Break of Structure ( BoS )             Order block ( OB )            Higher time frame Order block / Point of Interest ( POI )    shown on current chart           Fair value Gap ( FVG ) / Imbalance   -  MTF      ( Multi Time Frame )    HH/LL/HL/LH  -  MTF      ( Multi Time Frame )  Choch  MTF      ( Multi Time Frame )  Volume Imbalance     ,  MTF          vIMB Gap’s Power of 3 Equal High
    ICT, SMC, SMART MONEY CONCEPTS, SMART MONEY, Smart Money Concept, Support and Resistance, Trend Analysis, Price Action, Market Structure, Order Blocks, BOS/CHoCH,   Breaker Blocks ,  Momentum Shift,   Supply&Demand Zone/Order Blocks , Strong Imbalance, HH/LL/HL/LH,    Fair Value Gap, FVG,  Premium  &   Discount   Zones, Fibonacci Retracement, OTE, Buy Side Liquidity, Sell Side Liquidity, BSL/SSL Taken, Equal Highs & Lows, MTF Dashboard, Multiple Time Frame, BigBar, HTF OB, HTF Market Structure, 
    使用我们的自定义MT4指标发现成功外汇交易的秘诀! 您是否曾经想过如何在外汇市场上取得成功,一贯赚取利润,同时降低风险? 这是您一直在寻找的答案! 允许我们介绍我们的专有MT4指标,该指标将彻底改变您的交易方法。 独特的多功能性 我们的指标专为喜欢Renko和Rangebar Candle编队的用户而设计。 我们了解到,这些图表类型受到许多经验丰富的交易者的青睐,这就是为什么我们的指标与它们无缝集成,从而提供无与伦比的市场分析。 清晰的趋势信号 忘记复杂的分析! 我们的指标利用鲜艳的色彩和清晰的点结构来明确指示市场趋势。 红色和蓝色的点毫无疑问地对价格变动的方向留下了疑问,从而可以在您的交易中快速决策。 与HH/HL HL/LL策略对齐 如果您正在寻求一个指标,该指标无缝地与基于HH/HL和HL/LL结构的策略无缝合作,则不需要更多。 我们的工具不仅确定了这些形式,而且还促进了它们在投资过程中的有效利用。 绝对的清晰度和简单性 我们的首要任务是为您提供一种不仅有效而且易于使用的工具。 我们的指标是为了清晰而设计的,使您可以专注于做出投资决策,而不是
    Volatility Trend System - a trading system that gives signals for entries. The volatility system gives linear and point signals in the direction of the trend, as well as signals to exit it, without redrawing and delays. The trend indicator monitors the direction of the medium-term trend, shows the direction and its change. The signal indicator is based on changes in volatility and shows market entries. The indicator is equipped with several types of alerts. Can be applied to various trading
    TakePropips Donchian Trend Pro
    Eric John Pajarillaga Aldana
    4.82 (17)
    TakePropips Donchian Trend Pro   (MT4) 是一款功能强大且有效的工具,可使用 Donchian 通道自动检测趋势方向,并为您提供进场和退场交易信号! 这个多功能指标包括趋势扫描器、交易信号、统计面板、筛选器、交易时段和警报历史仪表板。它旨在为您提供交易信号并节省您分析图表的时间! 您可以在我们的博文中下载用户手册和安装指南:   https   :// www.mql5.com/en/blogs/post/751368 今天立减 50%!价格从 98 美元降到 49 美元! 您可以在 Strategy Tester 上测试该指标(启用可视模式) 视频教程也可在说明下方获得更多详细信息。 如果您有任何问题或需要任何帮助,请与我联系。 TakePropips Donchian Trend Pro 指标适用于所有外汇对、金属、商品、指数和加密货币。 主要特点 交易信号 - 检测多个时间范围内所有货币对的买卖机会。它将为您提供警报并在图表上绘制交易信号,最多 3 个止盈价和一个止损价。 Trend Scanner   - 用于快速扫描和识别跨多个时间
    Currency Strength Wizard
    Oleg Rodin
    4.91 (44)
    货币强度向导是一个非常强大的指标,为您提供成功交易的一体化解决方案。该指标使用多个时间范围内所有货币的数据来计算这个或那个外汇对的力量。此数据以易于使用的货币指数和货币电力线的形式表示,您可以使用它们来查看这种或那种货币的力量。 您所需要的只是将指标附加到您要交易的图表上,该指标将向您显示您交易的货币的真实强度。该指标还向您显示买卖量压力的极值,您可以在顺势交易时利用这些压力。该指标还显示了基于斐波那契的可能目标。该指标可用于各种交易时间范围。该指标支持各种货币对的交易。 该指标为您提供所有类型的警报,包括推送通知。 购买后请联系我。我将与您分享我的交易技巧,并免费为您提供丰厚的红利指标! 祝您交易愉快,获利丰厚!
    Break and Retest
    Mohamed Hassan
    4.43 (14)
    New update to V.4 where  Break & Retest automatically draws the take profit & stop loss levels and you also have more signals per day! ‍You can visually backtest Break & Retest to see how it behaved in the past!     Manual guide:   Click here $60 for a very limited time. Next price is $120   This Indicator only places quality trades when the market is really in your favor with a clear break and retest. Patience is key with this price action strategy! If you want more alert s
    Trend Screener
    STE S.S.COMPANY
    4.83 (88)
    趋势指标,趋势交易和过滤的突破性独特解决方案,所有重要趋势功能都内置在一个工具中! 它是 100% 非重绘多时间框架和多货币指标,可用于所有符号/工具:外汇、商品、加密货币、指数、股票。 趋势筛选器是有效的指标趋势跟踪指标,它在图表中提供带有点的箭头趋势信号。 趋势分析器指标中可用的功能: 1.趋势扫描仪。 2. 具有最大利润分析的趋势线。 3.趋势货币强度计。 4. 带有警报的趋势反转点。 5. 带有警报的强趋势点。 6. 趋势箭头 每日分析示例,每日信号表现...等与我们的趋势筛选指标,可以在这里找到: 点击这里 限时优惠:Trend Screener Indicator 仅售 50 美元且终身可用。原价 125$) 通过访问我们的 MQL5 博客,您可以找到我们所有的高级指标以及分析示例、每日信号表现...等。 : 点击这里 我们的趋势系统由 2 个指标组成: 1. Trend Screener Indicator:显示趋势仪表盘、图表中的趋势线、入场点...等。 2. Trend Line Map Indicator:显示买卖作为仪表板,活动信号盈利/亏损
    M1 Arrow
    Oleg Rodin
    5 (14)
    M1 Arrow - 基于市场的两个基本原则的盘中策略。 该算法基于使用附加过滤器对交易量和价格波动的分析。该指标的智能算法仅在两个市场因素合二为一时才会发出信号。该指标使用较高时间框架的数据计算 M1 图表上某个范围的波浪。为了确认波浪,该指标使用了成交量分析。 从理论上讲,该指标可以与其他时间框架一起使用,但您需要考虑到该指标最初是为在 M1 上交易而开发的这一事实。 该指标是一个现成的交易系统。交易者所需要的只是跟随信号。此外,该指标可以成为您自己的交易系统的基础。交易仅在分钟图表上进行。 尽管指标使用 MTF 原理,但指标算法尽可能稳定。 购买后,一定要写信给我!我将与您分享我的交易设置和建议!祝您交易成功!感谢您的关注!
    NAM Order Blocks
    NAM TECH GROUP, CORP.
    5 (1)
    MT4多時限訂單塊檢測指示器。 特徵 -在圖表控制面板上完全可自定義,提供完整的交互。 -隨時隨地隱藏和顯示控制面板。 -在多個時間範圍內檢測OB。 -選擇要顯示的OB數量。 -不同的OB用戶界面。 -OB上的不同過濾器。 -OB接近警報。 -ADR高低線。 -通知服務(屏幕警報|推送通知)。 概括 訂單塊是一種市場行為,它指示從金融機構和銀行收取訂單。著名的金融機構和中央銀行帶動了外匯市場。因此,交易者必須知道他們在市場上正在做什麼。當市場建立訂單塊時,它會像發生大多數投資決策的範圍一樣移動。 訂單建立完成後,市場將朝著上升和縮小的方向發展。訂單大宗交易策略的關鍵術語是它包括機構交易者正在做的事情。由於它們是主要的價格驅動因素,因此包括機構交易在內的任何策略都可以。 您將在任何時間範圍內實時看到訂單塊,使用我們的控制面板,您將能夠在所選的歷史記錄週期內檢測常規,拒收和未大寫的訂單塊。 現在您可以接收到訂單塊接近警報,我們在MT4上顯示屏幕通知,並將通知推送到您的手機!
    Advanced Currency IMPULSE with ALERT
    Bernhard Schweigert
    4.91 (494)
    目前31%的折扣!! 对任何新手或专家交易者来说都是最好的解决方案! 这个指标是一个独特的、高质量的、负担得起的交易工具,因为我们已经纳入了一些专有的功能和一个秘密的公式。只需一张图表,它就能给出所有28种货币对的警报。想象一下,你的交易将如何改善,因为你能够准确地确定新趋势或剥头皮机会的触发点 建立在新的基础算法上,它使识别和确认潜在交易变得更加容易。这是因为它以图形方式显示了一种货币的强势或弱势是否正在加速,并测量了这种加速的速度--把它想象成你汽车中的速度表。当你加速时,事情显然会发生得更快,这在外汇市场上也是一样的,即如果你配对的货币正在向相反的方向加速,你就会发现一个潜在的有利可图的交易。 货币动量的垂直线和箭头将指导你的交易! 动态的市场斐波那契23水平被用作警报触发器,将适应市场活动。如果冲动触及黄色触发线,您将在MetaTrader或您的电子邮件或推送警报中收到警报。然后你就知道作为一个交易员应该做什么。货币对和方向已经给出。只要点击警报按钮,就可以切换到该货币对或打开一个新的图表,以便进一步分析。警报级别可以通过用户输入来改变,可以选择3个敏感度级别
    Up Down v6
    Guner Koca
    4.88 (8)
    up-down indicator is no repaint and works all pairs and lower than weekly time frames charts. it is suitable also 1 m charts for all pairs. and hold long way to signal. dont gives too many signals. when red histogram cross trigger line that is up signal.and price probably will down when blue histogram cross trigger line that is down signal.and price probably will go up. when the signals not seen press + button on terminal . too see weekly chart because of low data on chart ,it needs to lower p
    Entry Points Pro
    Yury Orlov
    4.7 (226)
    这是一款 MT4 的趋势指标,可提供准确的入场交易信号,且无重绘或延迟。 它可应用在任何金融资产:外汇、加密货币、贵金属、股票、指数。 最好的结果出现在 M15+ 的时间帧内。 指标的 MT5 版本 重要! 购买后请联系我,以便获取详细指南和奖励。 视频 (6:22) - 一个信号赢取的利润等于指标价格的三倍。 视频 (4:44) - 它如何在测试器中工作,我的提示和技巧。 视频 (1:44) - 有关它如何处理加密货币和指数的几句话。 大多数交易者在 Entry Points Pro 指标的帮助下,在第一个交易周内就改善了他们的交易结果。 Entry Points Pro 指标的益处 入场信号无重绘或延迟 如果信号出现,并得到确认(如果信号所在烛条已收盘),则它不会再消失;不像是重绘指标,它会导致重大的财产损失,因为它们可以在显示信号后再将其删除。 无差错开仓 指标算法可令您找到入场交易(买入或卖出资产)的理想时机,从而提高每位交易者的成功率。 Entry Points Pro 可操作任何资产 它允许您在 MT4 平台上交易任何经纪商提供的加密货币、股票、
    BullsEye Signal NoRepaint
    Martin Alejandro Bamonte
    BullseyeSignal – NoRepaint 是一种信号,如其名称所示,在任何情况下都不会重新绘制。信号在图像中观察到的同一根蜡烛上发出。它非常适合高度波动的市场,如外汇、加密货币、股票、指数和期货。 你只会看到绿色箭头表示买入和红色箭头表示卖出,但背后有许多指标共同工作,以提供更简化的交易体验。 它专为提供精确的进入点而设计, 不是大量的,而是特定的进入点,当我们的指标显示趋势变化并穿过0水平线与前一趋势相反时。为了实现更精确的交易,指标等待第一个回调以确认趋势变化,从而避免假反转。因此,在突破前一趋势并确认回调后,将发出信号。 这是一种非常谨慎的交易方法, 因此重要的是要遵循这些提示(新手和更高级的交易者都可以使用这种策略): 建议使用纽约市场、伦敦市场或两者重叠的市场。如果你需要在其他市场交易,例如亚洲市场,必须事先检查交易的货币对是否处于非常狭窄的范围内。范围市场:可以交易吗?可以,但要交易任何处于范围内的货币对,你必须观察货币对和范围长度。例如,如果你在M5图表上,合适的范围大约是200点(最高点和最低点之间)。如果范围较小,我们将得到很少的点数,甚至可能遇到
    作者的更多信息
    ADX Signal AM
    Andriy Matviyevs'kyy
    4.75 (4)
    The indicator is an interpretation of the Average Directional Movement Index (ADX) allowing you to determine if there is a price trend. It was developed by Welles Wilder and described in his book "New concepts in technical trading systems". The indicator shows signals on the price chart when +DI и -DI intersect and when an ADX value rises or falls relative to the +DI и -DI positional relationship. The indicator's buy signals work just like a support level, while the sell signals work like a resi
    FREE
    MFI Signal AM
    Andriy Matviyevs'kyy
    5 (3)
    This indicator displays the signals based on the values of the classic Money Flow Index (MFI) indicator on the price chart. The volume is considered during the calculation of the MFI values. The MFI can be used for determining the overbought or oversold areas on the chart. Reaching these levels means that the market can soon turn around, but it does not give signal, as in a strong trend the market can stay in the overbought or oversold state for quite a long time. As with most oscillators, the s
    FREE
    SuperTrend AM
    Andriy Matviyevs'kyy
    5 (1)
    SuperTrend AM is an indicator that allows you to open a position at the very beginning of a significant price movement. The second most important quality of the indicator is the ability to follow the trend as long as possible in order to obtain all potential profits while minimizing potential losses. This indicator does not repaint or not recalculate. A version of this indicator with advanced settings and signal notifications is  SuperTrend 3 AM . Signal of the indicator: red arrow appearing a
    FREE
    ADX Trigger AM
    Andriy Matviyevs'kyy
    5 (1)
    The indicator is an interpretation of the Average Directional Movement Index (ADX) allowing you to determine if there is a price trend. It was developed by Welles Wilder and described in his book "New concepts in technical trading systems". The indicator determines entry points and uses crossing of ADX +/- lines and growth or fall of the main ADX line. When the indicator crosses the zero line, the trend is changed. If the oscillator's value is 1 - the price grows, the trend remains; If the oscil
    FREE
    ADX Line AM
    Andriy Matviyevs'kyy
    4.67 (3)
    The indicator analyzes ADX and ATR data to define the current trend and allow traders to gain maximum profit from strong price movements. The indicator is intuitively clear: line direction change - trend direction change. Change of the line color warns of a coming direction change. Extended version of this indicator - Line on Osc . Customized parameters: Ind_Period (>1) - ADX calculation period; Sensitivity (>1) - ATR sensitivity. Alerts - show a dialog box containing user data; Send_Mail - send
    FREE
    FATL Momentum AM
    Andriy Matviyevs'kyy
    This technical indicator is a Momentum indicators built using a fast adaptive digital filter - FATL. In a simplified sense, an adaptive digital filter is a moving average with effective smoothing. Using a digital filter allows you to smooth out sharp fluctuations with minimal signal delay. Using the indicator: It should be taken into account that the values ​​of the indicator on the zero bar (which has not finished forming yet) may change, so decisions should be made after the end of the bar for
    FREE
    Impulsive Trade AM
    Andriy Matviyevs'kyy
    This indicator displays elements of the trading system described by Alexander Elder. This indicator uses the idea of opening sell deals in the period of MACD (or OsMA) falling below zero and opening buy deals when the indicator values rise above zero, in case this fall or rise coincide with the Moving Average direction. The thick and thin histograms correspond to the values of MACD and OsMA. If a histogram is above 0, the indicator value is greater than 0. If it is below, the indicator value is
    FREE
    ZT Signal AM
    Andriy Matviyevs'kyy
    The indicator displays elements of the trading system, name trading in the zone, described by Bill Williams. Sell signals are formed when MACD and OsMA values are falling simultaneously (Bill Williams calls these indicators АО and АС in his book), while buy signals appear when both indicators are rising. The indicator has no configurable parameters. (Indicator variant in which MACD and OsMA parameters can be changed - ZT Signal 2 AM ). The indicator signals are confirmed when the price exceeds t
    FREE
    BarLineBreak AM
    Andriy Matviyevs'kyy
    4 (1)
    The indicator detects the current trend using the following definition: A trend is a market situation when each subsequent peak is higher/lower than the previous one, as well as each subsequent bottom is higher/lower than the previous one. Exceeding all previous peaks/bottoms on the specified amount of bars by the current peak/bottom is considered to be a beginning of a new trend. The indicator paints bars according to an identified trend. The indicator does not repaint. Settings: Lines_Bre
    FREE
    Step RSI AM
    Andriy Matviyevs'kyy
    5 (2)
    This indicator is an interpretation of the values of the classic indicator - RSI. A filter is used to smooth the sharp fluctuations of the indicator values, eliminating the weak changes and focusing the trader's attention on strong fluctuations of values. The indicator is not redrawn on completed bars. For greater efficiency of this indicator, it should be used in conjunction with the indicators that identify the trend direction, as well as support/resistance levels. Signals: Histogram crossing
    FREE
    Laguerre Osc 2 AM
    Andriy Matviyevs'kyy
    The presented indicator uses the Laguerre filter to build an oscillator. The indicator has the possibility of double additional smoothing, which can be useful for small values ​​of the Gamma parameter. The indicator gives three types of signals: Exit of the oscillator from the overbought / oversold zone; The oscillator crossing the middle of the value between the overbought/oversold zones; The oscillator enters the overbought/oversold zone. On fully formed candles, the indicator does not redraw.
    FREE
    CCI Signal AM
    Andriy Matviyevs'kyy
    This indicator displays the signals based on the values of the classic CCI indicator on the price chart. The CCI can be used for determining the overbought or oversold areas on the chart. Reaching these levels means that the market can soon turn around, but it does not give signal, as in a strong trend the market can stay in the overbought or oversold state for quite a long time. As with most oscillators, the signals are generated when leaving these areas. This indicator allows to display three
    FREE
    ADX Candles AM
    Andriy Matviyevs'kyy
    This indicator colors candles in accordance with the projected price movement. The analysis is based on the values of the classic ADX. If the DMI+ line is above the DMI- line - the candlestick is painted in color that signals a price growth; If the DMI+ line is below the DMI- line - the candlestick is painted in color that signals a price fall. The indicator does not redraw on completed candlesticks. The forming candlestick can change its color depending on the current data. Thus, it is recommen
    FREE
    RSX Signal AM
    Andriy Matviyevs'kyy
    The indicator displays the signals of the RSX oscillator. The main type of signal is given when the oscillator exceeds the 0 value. If the "Sensitivity" parameter increases above zero, the main signal will also be given when overbought/oversold levels are overcome, defined as zero plus sensitivity and zero minus sensitivity. An additional signal is given when the direction of the oscillator line changes. It is optimal to use the indicator signals as signals to open a trade when the price overcom
    FREE
    WPR Signal AM
    Andriy Matviyevs'kyy
    This indicator displays the signals based on the values of the classic WPR indicator. The WPR indicator can be used for determining the overbought or oversold areas on the chart. Reaching these levels means that the market can soon turn around, but it does not give signal, as in a strong trend the market can stay in the overbought or oversold state for quite a long time. As with most oscillators, the signals are generated when leaving these areas. This indicator allows to display three types of
    FREE
    RSI Signal AM
    Andriy Matviyevs'kyy
    This indicator displays the signals based on the values of the classic RSI indicator on the price chart. The RSI can be used for determining the overbought or oversold areas on the chart. Reaching these levels means that the market can soon turn around, but it does not give signal, as in a strong trend the market can stay in the overbought or oversold state for quite a long time. As with most oscillators, the signals are generated when leaving these areas. This indicator allows to display three
    FREE
    HyperSignal AM
    Andriy Matviyevs'kyy
    The  indicator generates signals for opening positions. The principle of operation is to compare the current average price with a range of average prices over a longer period. The signals are confirmed when the price exceeds the High/Low of the bar where the indicator generated the signal.  Maintenance of an open position is carried out on a smaller TF. Indicator signals to open an opposite position on a smaller TF are a signal to close the deal. This indicator does not repaint or not recalculat
    FREE
    TTF Candles AM
    Andriy Matviyevs'kyy
    5 (1)
    This indicator displays the moment when the TTF oscillator crosses the zero value, and the moment when the TTF oscillator crosses its smoothed value. Crossing the zero value by the TTF oscillator is a buy/sell signal. If the TTF oscillator crosses its smoothed value, it is a signal of a trend change. The signal is given after the end of the formation of the candle. The signal is confirmed when the price crosses the high/low of the bar on which the signal was given. The indicator does not redraw.
    FREE
    Zone Trade AM
    Andriy Matviyevs'kyy
    The indicator is based on the elements of Bill Williams' trading system. Sell signals are formed when MACD and OsMA values are falling simultaneously (Bill Williams calls these indicators АО and АС in his book), while buy signals appear when both indicators are rising. Thick and thin colored histograms match MACD and OsMA values. If the histogram is greater than 0, the indicator value is rising. Otherwise, it is falling. Positions should be opened when the price exceeds the bar's high or low, at
    FREE
    DeM Signal AM
    Andriy Matviyevs'kyy
    This indicator displays the moment when the DeMarker oscillator crosses its smoothed value. If the DeMarker oscillator crosses its smoothed value, it is a signal of a trend change. The signal is given after the end of the formation of the candle. The signal is confirmed when the price crosses the high/low of the bar on which the signal was given. The indicator does not redraw. Custom Parameters: DeM_Period (>1) - DeMarker indicator period; MA_Period - period for smoothing DeMarker indicator va
    FREE
    EasyTrend AM
    Andriy Matviyevs'kyy
    EasyTrend AM is an indicator that allows you to open a position at the very beginning of a significant price movement. The second most important quality of the indicator is the ability to follow the trend as long as possible in order to obtain all potential profits while minimizing potential losses. This indicator does not repaint or not recalculate. A version of this indicator with advanced settings and signal notifications is EasyTrend 3 AM . Signal of the indicator: red arrow appearing abov
    FREE
    TTF Osc AM
    Andriy Matviyevs'kyy
    This indicator displays the moment when the TTF oscillator crosses the zero value, and the moment when the TTF oscillator crosses its smoothed value. Crossing the zero value by the TTF oscillator is a buy/sell signal. If the TTF oscillator crosses its smoothed value, it is a signal of a trend change. The signal is given after the end of the formation of the candle. The signal is confirmed when the price crosses the high/low of the bar on which the signal was given. The indicator does not redraw.
    FREE
    FATL Line AM
    Andriy Matviyevs'kyy
    The presented indicator is a moving average based on the fast digital filter (FATL) data. Using the indicator is similar to using a standard moving average: For small values ​​of the period of the moving average (1-10): Buying/selling is carried out at the moment of changing the direction of the moving average (after the price has overcome the high/low of the bar on which the change of direction occurred). For large values ​​of the period of the moving average: Buying / selling is carried out de
    FREE
    SATL Alligator AM
    Andriy Matviyevs'kyy
    This indicator is a combination of classic trend indicator and signals of the slow digital filter. The indicator has no configurable parameters. The signals are displayed on completed bars and are not redrawn. It shows high efficiency on periods less than 1 hour. The usage principle is intuitive - trade in the direction shown by the fan of moving averages. Enter once the price exceeds the High/Low of the bar where the signal was formed. Exit on the opposite conditions.
    FREE
    FATL cci AM
    Andriy Matviyevs'kyy
    The product combines the best features of the standard CCI oscillator with the adaptive digital filter. The indicator allows entering and exiting the market at the very beginning and end of a trend. The indicator generates high-probability signals while retaining high sensitivity. The indicator does not repaint on fully formed bars. Options: Ind_Price - price used for the indicator calculation; Ind_Period - indicator period. Application rules: A big red dot - a strong bearish trend, if the price
    FREE
    Stop Bar AM
    Andriy Matviyevs'kyy
    The indicator accurately identifies a short-term trend both on trend and flat markets. The confirmation of the signal is the overcoming by the price of the high/low of the bar on which the signal was given. Signals are given on fully formed bars and are not redrawn. Calculations are based on the system of Moving Averages. The indicator is highly sensitive. Use it together with other technical analysis indicators. Settings: Sensitivity - amount of bars for the indicator calculation (1 or higher
    FREE
    TTF Line AM
    Andriy Matviyevs'kyy
    The indicator analyzes TTF and ATR data to define the current trend and allow traders to gain maximum profit from strong price movements. The indicator is intuitively clear: line direction change - trend direction change. Change of the line color warns of a coming direction change. Customized parameters: Ind_Period (>1) - TTF calculation period; Sensitivity (>1) - ATR sensitivity. Alerts - show a dialog box containing user data; Send_Mail - sends an email using an address specified on the Em
    FREE
    FATL Alligator AM
    Andriy Matviyevs'kyy
    This indicator is a combination of classic trend indicator and signals of the fast digital filter. The indicator has no configurable parameters. The signals are displayed on completed bars and are not redrawn. It shows high efficiency on periods greater than 1 hour. The usage principle is intuitive - trade in the direction shown by the fan of moving averages. Enter once the price exceeds the High/Low of the bar where the signal was formed. Exit on the opposite conditions.
    FREE
    FATL Arrows AM
    Andriy Matviyevs'kyy
    This indicator generates signals when the close price values ​​go beyond the channel built using the FATL fast digital filter. Application is extremely simple: The up arrow is a buy signal. Down arrow - sell signal. The signal must be confirmed by the price breaking the high/low of the bar on which the signal was given. The indicator is effective for trend trading. Thus, to open a position, it is necessary to take into account the trend of a higher period. Signals against the trend of a higher p
    Fine Trade AM
    Andriy Matviyevs'kyy
    5 (1)
    Not all price changes can be used for trading, as small price fluctuations do not allow you to make a profit. The presented indicator with high efficiency gives signals about the moments of a significant change in the direction of price movement. The indicator is intuitive and easy to use. The indicator signal is generated after the completion of the bar, where the indicator changes its position relative to zero. Never repaints signal. The indicator signals must be confirmed by the price exceedi
    筛选:
    无评论
    回复评论
    版本 26.2 2023.10.04
    Updated.
    版本 26.1 2023.09.25
    Updated.
    版本 26.0 2023.09.24
    Updated to version 26+.
    版本 25.0 2023.08.22
    Updated to version 25+.
    版本 1.80 2023.07.15
    Fixed bug.
    版本 1.70 2023.07.12
    New version.
    版本 1.60 2023.07.05
    Updated.
    版本 1.50 2023.06.04
    New version.