Power Trade Indicator
- 指标
- Joel Malebana
- 版本: 1.2
- 激活: 5
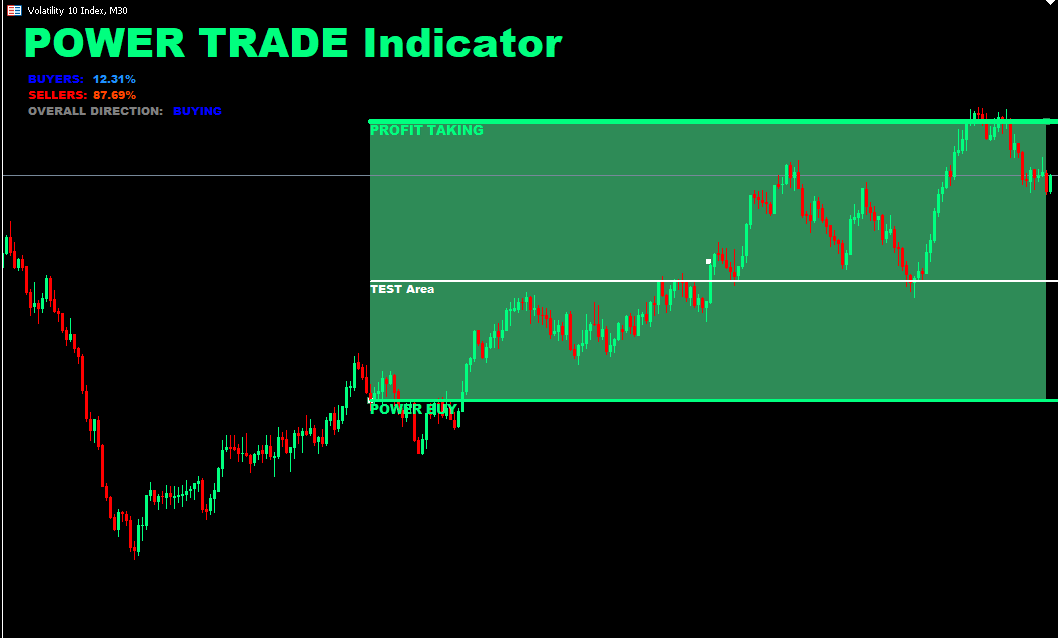
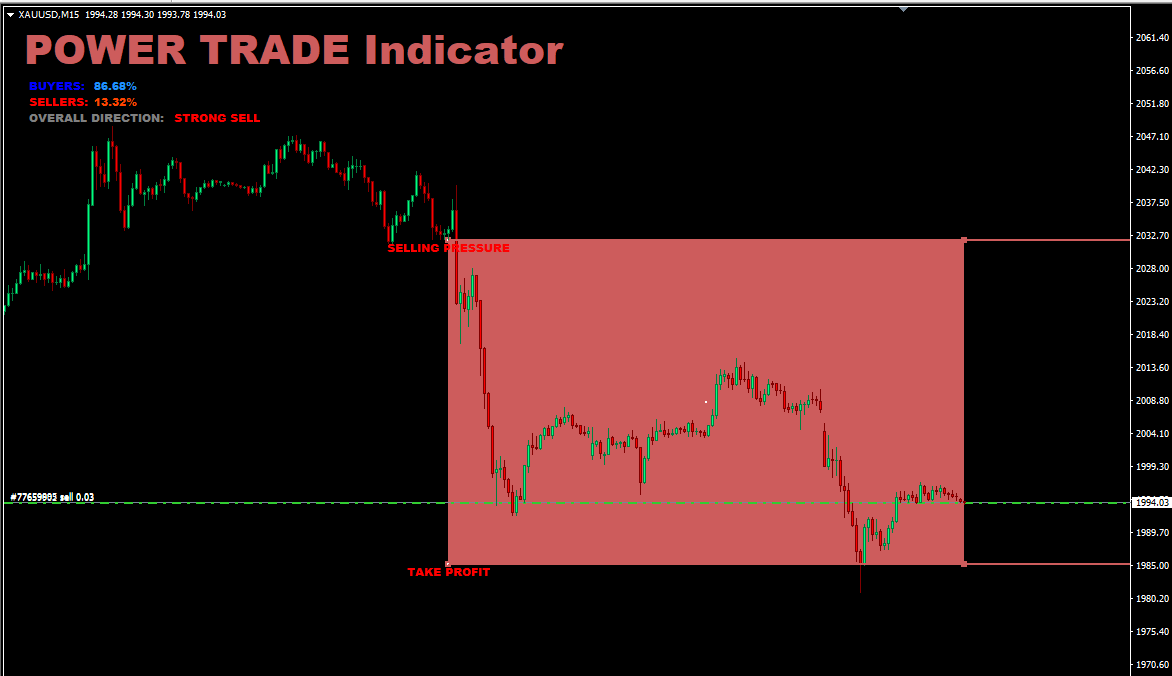
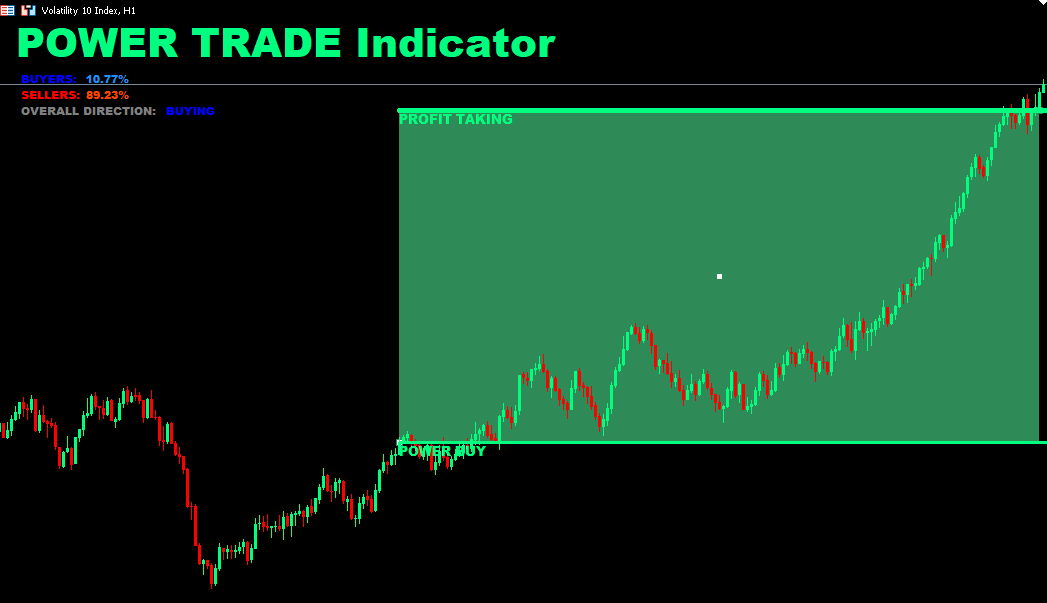
Introducing the POWER TRADE indicator created by a small group of traders with a few years trading trading the financial market profitably . This is a plug and play indicator that provides you with POWERFUL Entry signals with Profit Taking and rebound zones. The indicator Works with all MT5 trading instruments. The indicator uses previous chart data as receipt to speculate on future market moves.