Black Elements Gold
Black Elements Gold is a professional Multi-Time frame price action based indicator that calculates the weekly trend.
This indicator is coded using multiple algorithms crafted specifically for each section it provides.
Each week, you will be provided the following:
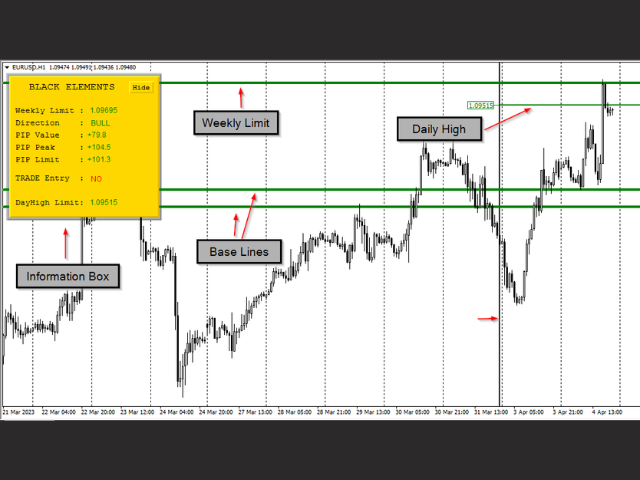
- Two horizontal base lines
- a weekly limit line
- a daily 'high' or 'low' line per day
- trade entry signal
- Pip Calculator
- pip value
- pip peak
- pip limit
How it works:
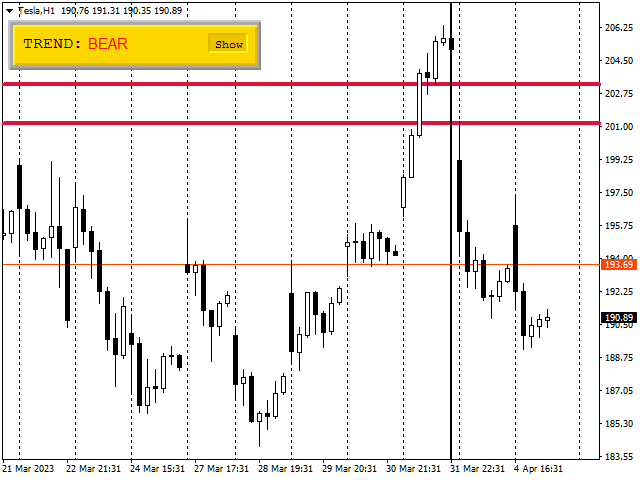
Two Horizontal Base Lines
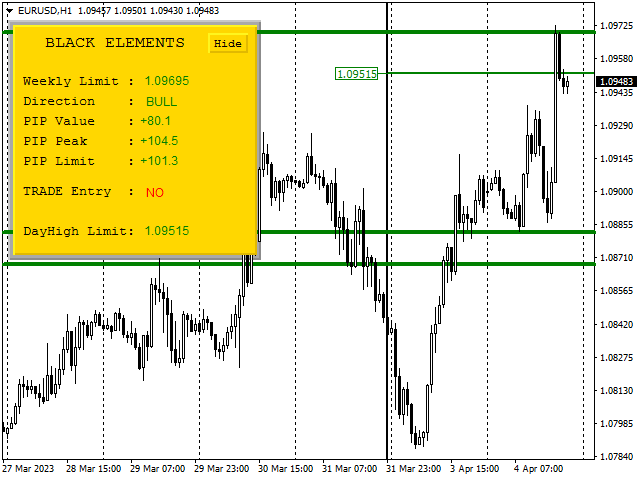
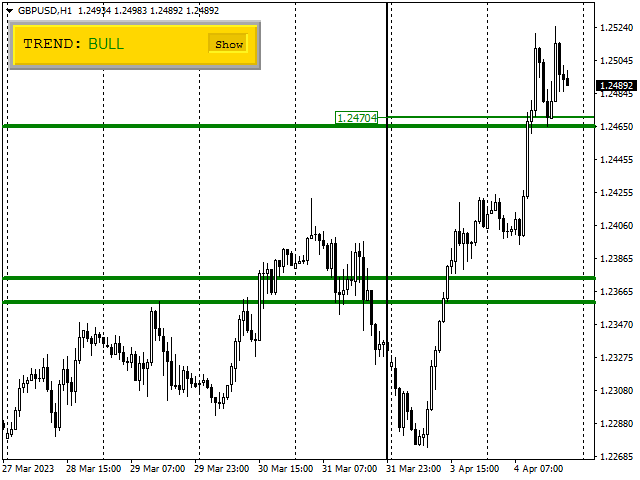
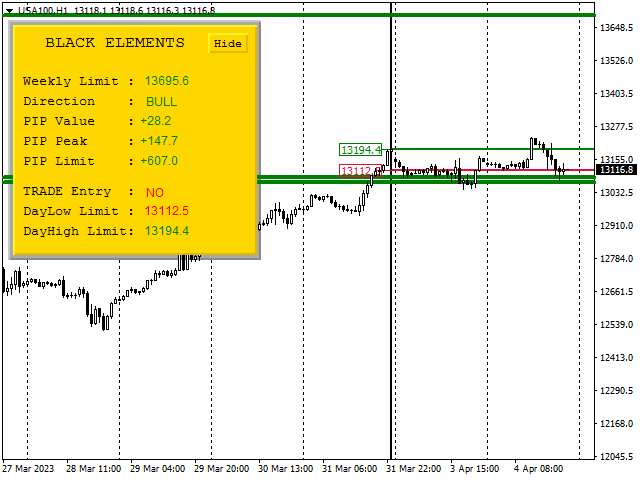
- if the two base lines are green, it means the market may be bullish. You may look for bull signals in your own analysis.
- price will be above the two lines.
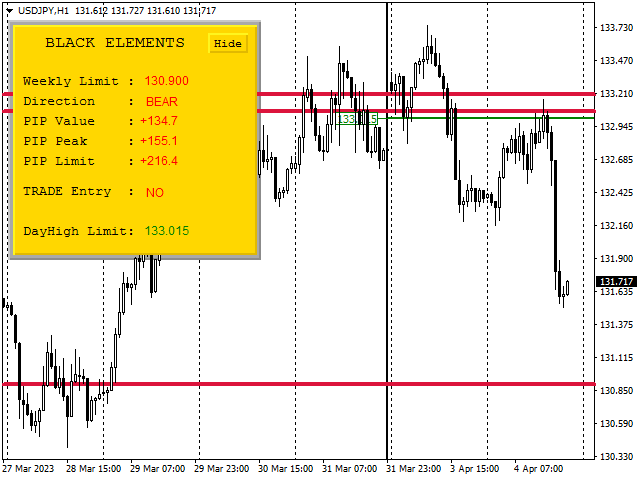
- if the two base lines are red, it means the market may be bearish. You may look for bear signals in your own analysis.
- price will be below the two lines.
if the price crosses over from one side to the other, the two horizontal lines will change color and ultimately change direction of the 'trend recommended' as well.
if the two lines are black, it means price is in between, you may trade either based on previous recommendation or wait for a breakout.
Weekly limit Line
When a trend direction has been recommended, a weekly limit line will be provided.
Using our specialized algorithm, an accurate assessment of how far price will go for the week will be provided.
if price chooses to change direction and ultimately change the trend, the amount of movement done on the other
side of the lines will also be taken into consideration and re-calculate how far price can still move.
The weekly limit line is not fixed and will always adapt to how much more price can move.
The color of the weekly limit line will be determined by the color of the current recommended trend.
Daily High and Low
The daily high and low lines use a different algorithm from the weekly limit line. Each of these levels are specifically coded
for high accuracy. This will help in understanding exactly how far price can still go per direction. This will help avoid entering when
momentum has died. They also can help in understanding when a reversal might happen.
You will not be presented with each of these lines in the beginning of the day as they will only appear when they have been
successfully calculated using real time data for the day. These lines will appear only when our algorithm finds that price has
reached its peak momentum.
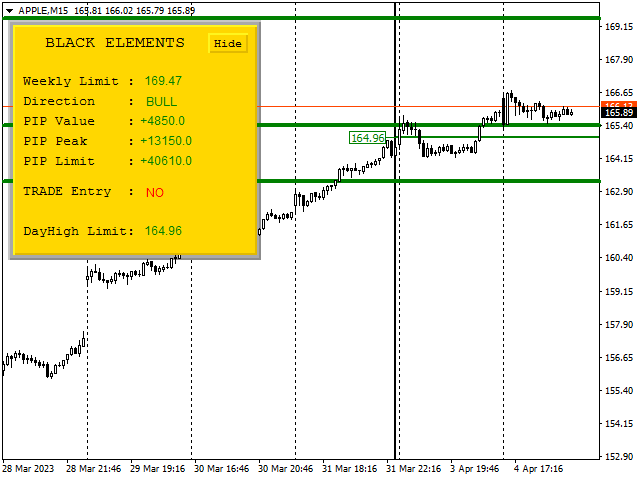
Daily high will appear with a green line and also provide value of price next to it or in the info box.
Daily low will appear with a red line and also provide value of price next to it or in the info box.
Trade Entry Signal
This is a signal that lets you know when it is best to open a position or not using this indicator.
While your own discretion is advised when to open a position, this signal will only act as a recommendation
When it is safe to enter, trade signal will say 'yes'
When price has gone to far from the base lines, signal will say 'no'.
Pip Calculator
pip value
The pip value gives you the value of where price is relative to the baseline. The amount of pips is from the baseline to current price.
pip peak
The pip peak gives you the value of how far price has moved relative to the baseline.
The amount of pips is from the baseline to highest price point if the trend is bull or the lowest price point if the trend is bear.
pip limit
The pip limit gives you the value of how far price could go relative to the baseline. The amount of pips is from the baseline to the weekly limit line.