ICT Template MT5
- 指标
- David Perk
- 版本: 2.3
- 更新: 17 十月 2023
- 激活: 10
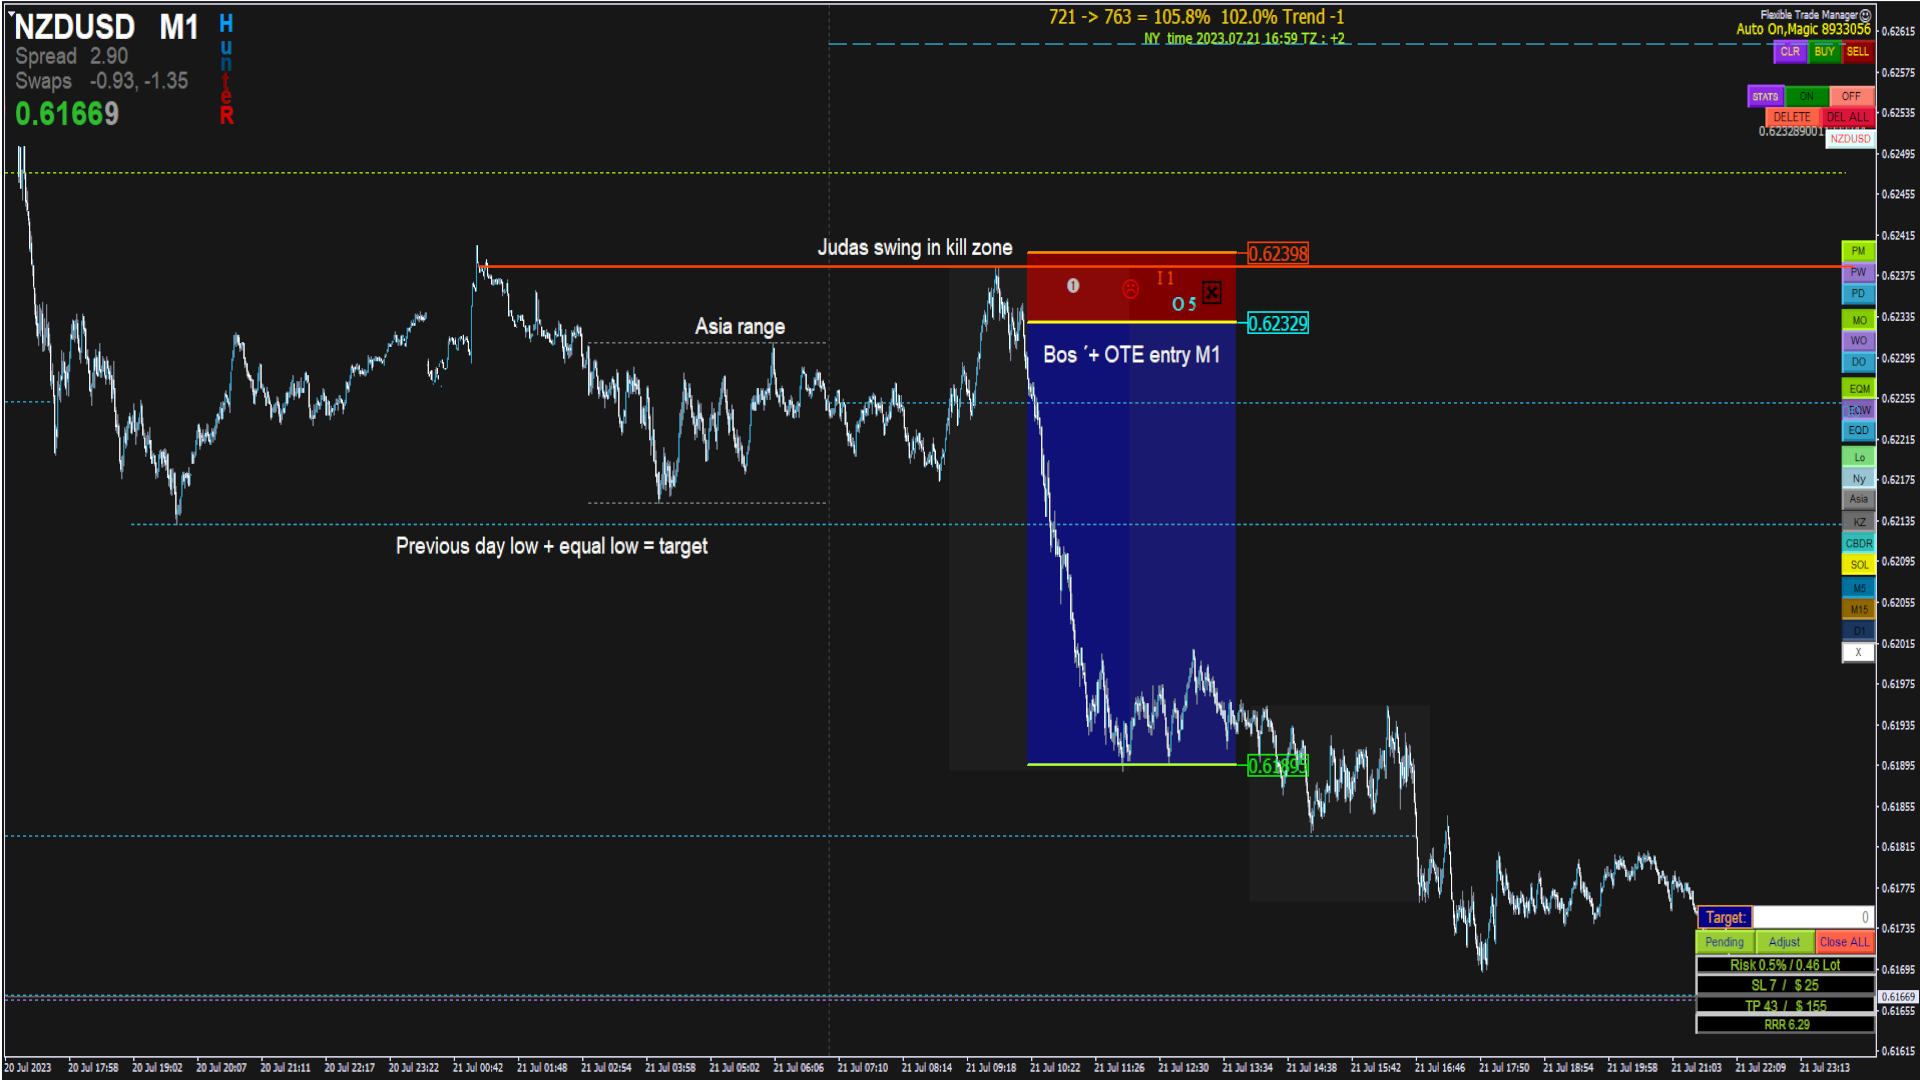
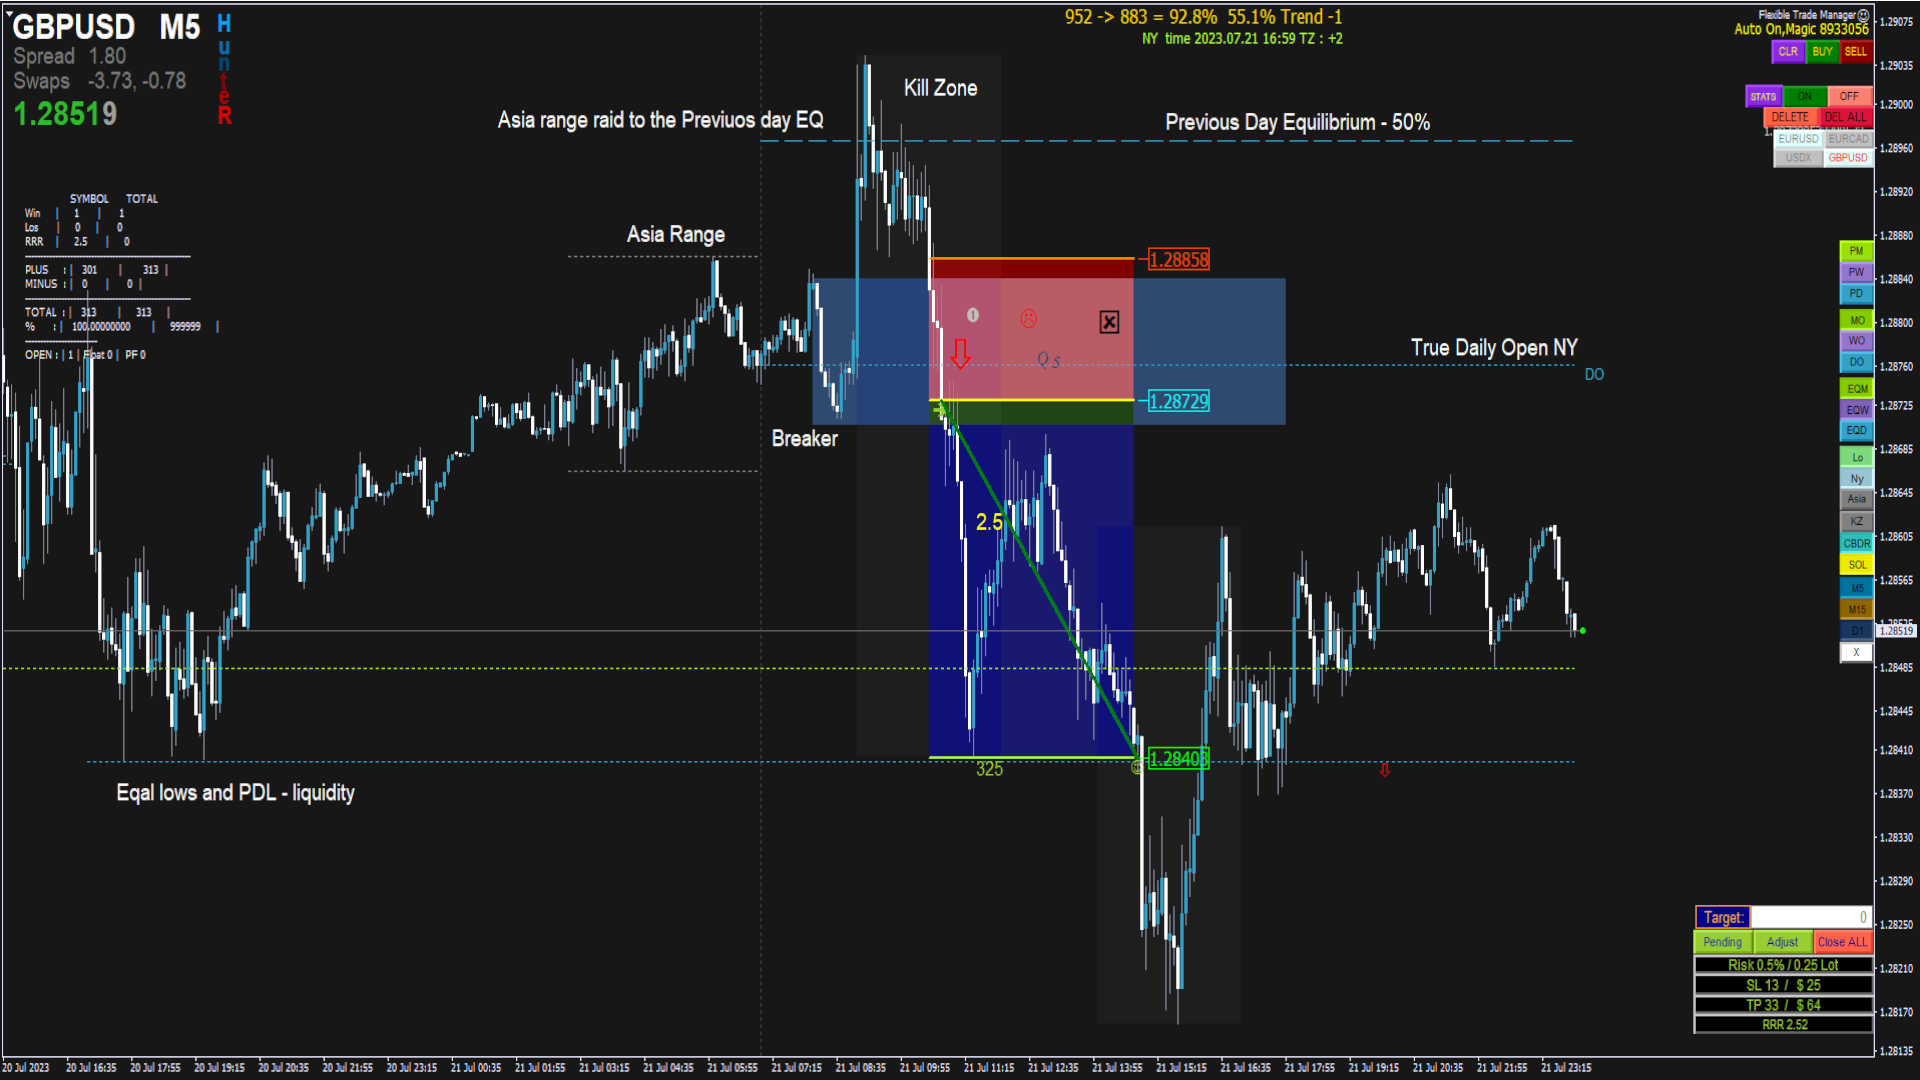
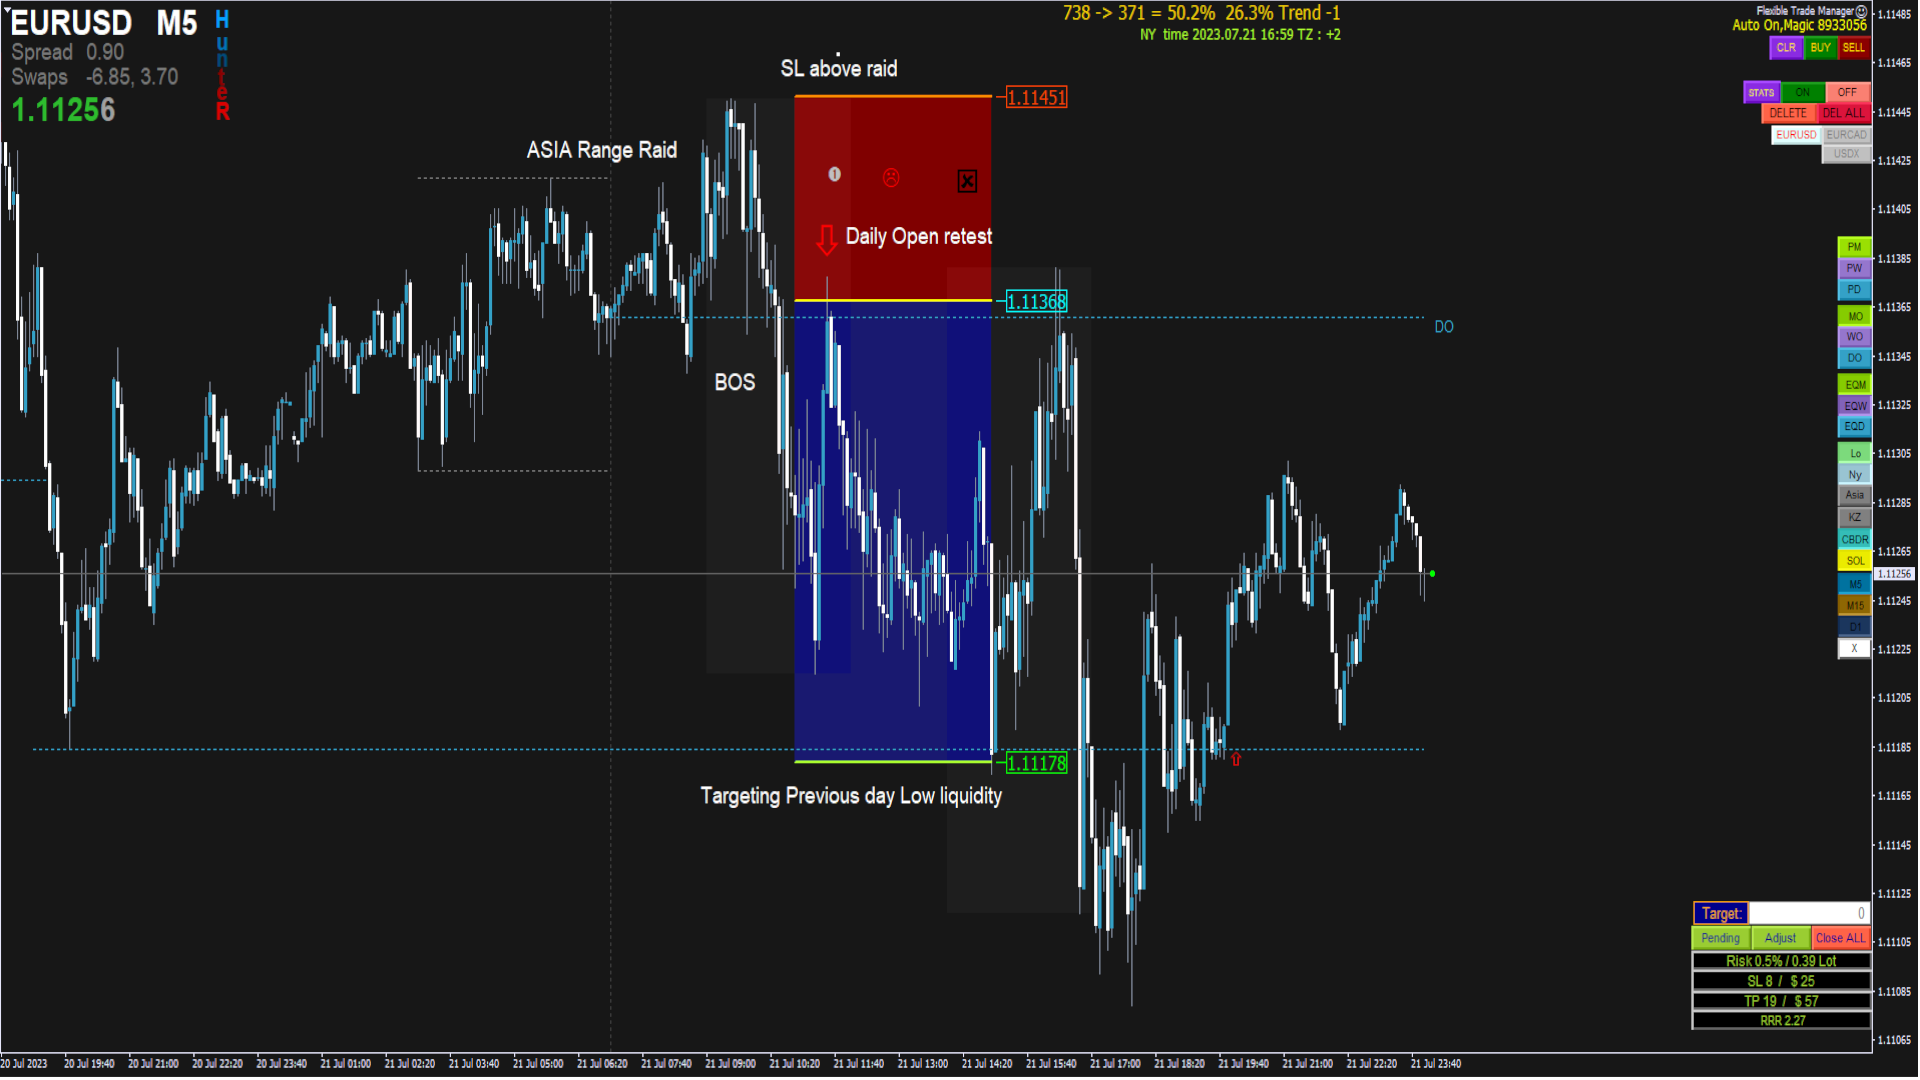
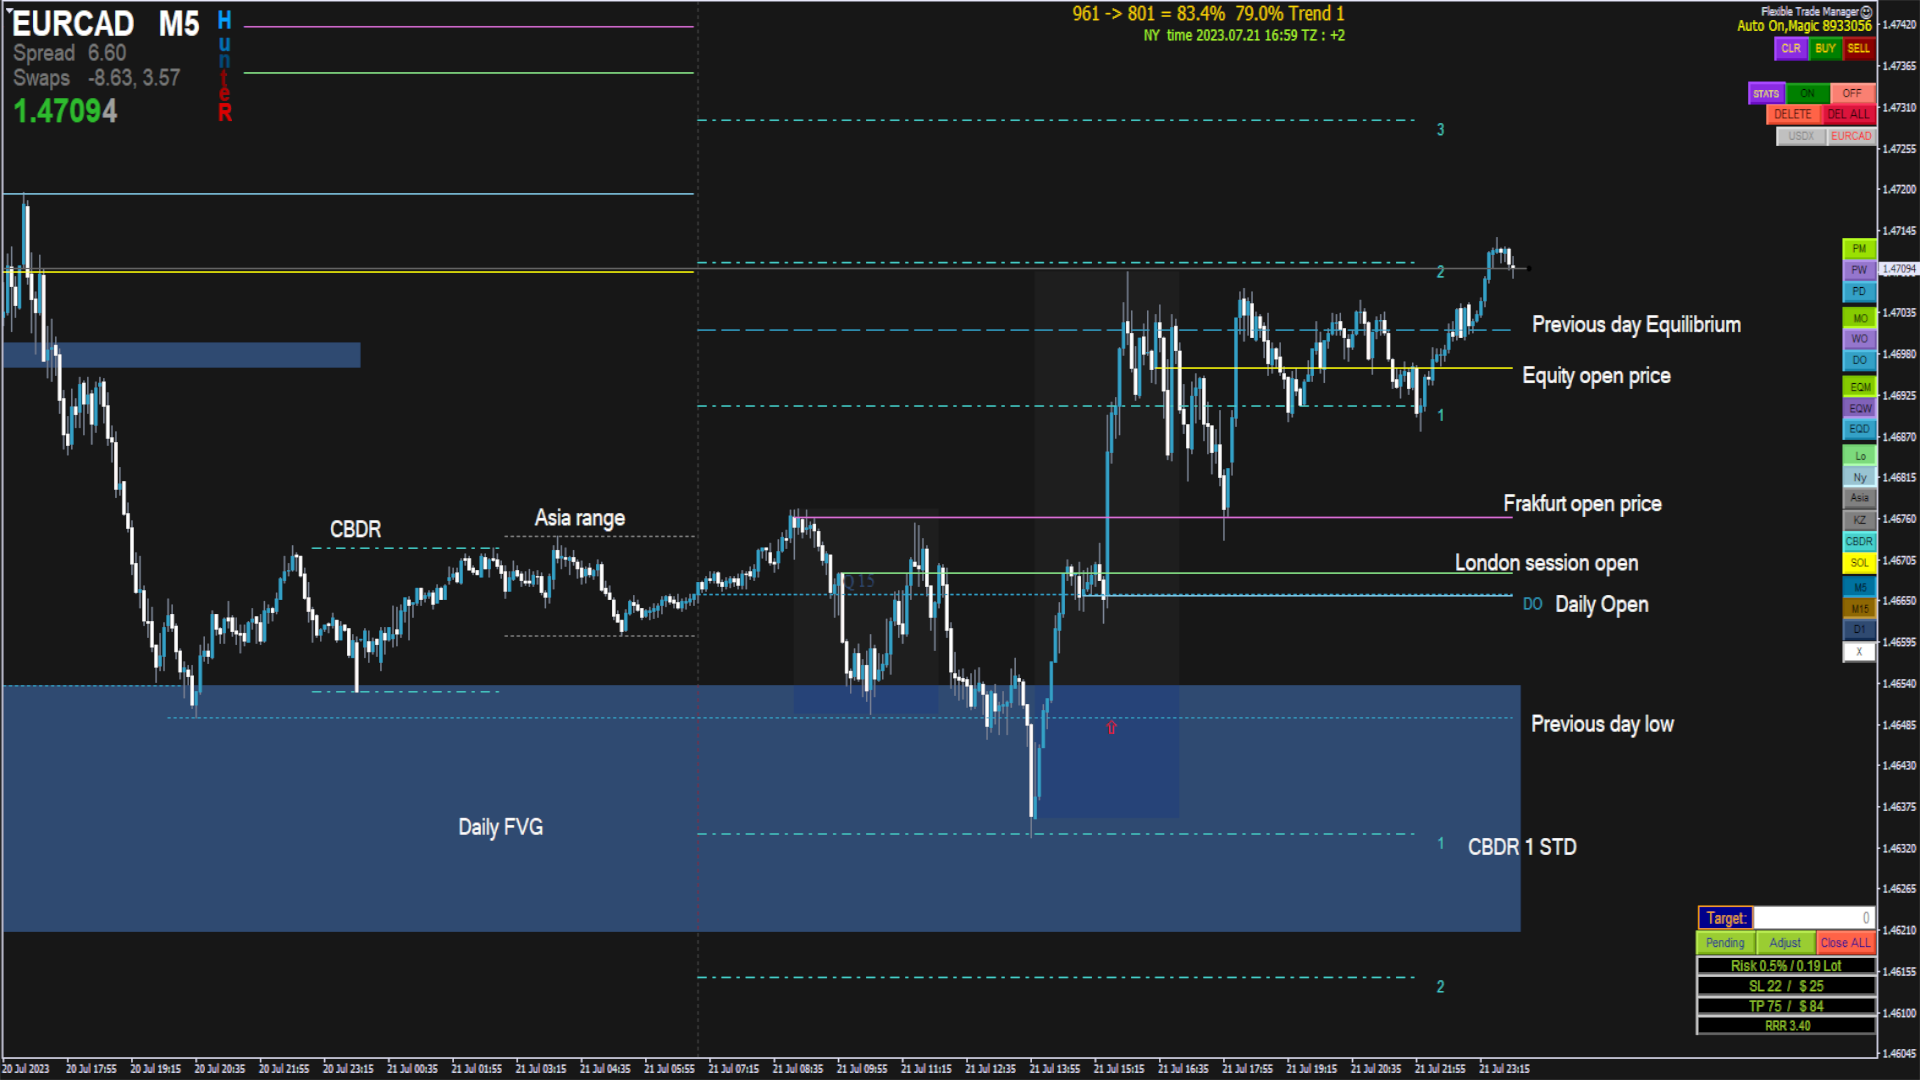
ICT Template Indicator visualizes and automatically updates all important ICT elements for Scalpers, Day and Swing traders. It allows you too keep your chart clean and bring any elements by just one click to the buttons. Thanks to mobile notifications on external liquidity levels, you will not miss any opportunity and you don't have to sit behind the screens whole day. Each element has fully customizable colours, width, line types, max timeframe to be shown etc... so you can really tweak your charts in to the each detail and focus just on the execution's of your setups. Of course everything is auto synchronized with IPDA true day - NY time. For faster and more comfortable analysis I have included a keyboard hot keys for 3 rectangles, 3 horizontal Lines, and two fib´s with variable values for dealing ranges and optimal trade entry. 3 months of daily practice with this tool and you will improve by 100%.
!! NEW VERSION IS UNDER DEVELOPMENT !! - If you don't rely on MT5 - please rather choose MT4 version.
Here is a simple trading strategy which I used with this indicator and passed my challenges - https://www.mql5.com/en/blogs/post/750916
MT4 Version - https://www.mql5.com/en/market/product/88959
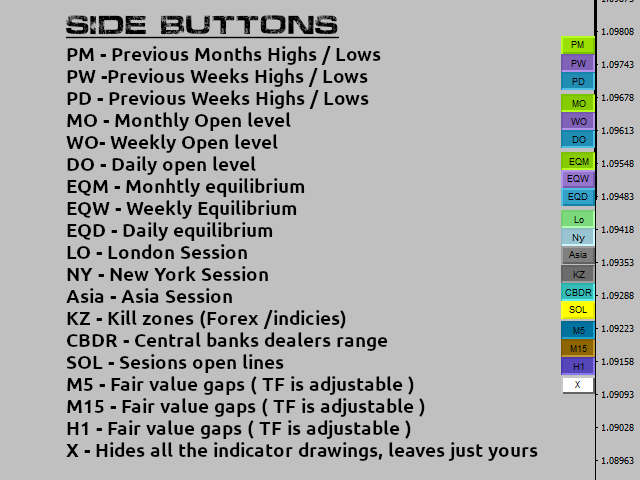
ICT Elements included in the Indicator
- Monthly - High/lows/open/equilibrium
- Weekly - High/lows/open/equilibrium
- Daily - High/lows/open/equilibrium
- Sessions - Asia, London, New York,
- Sessions open levels - Frankfurt, London, New York, Equity Open
- Kill zones - Forex / Indices (am/pm sessions)
- Central Bank Dealer Range - CBDR, fully customizable up to 10 levels
- Fair Vale Gaps - Multi timeframe view coded for all timeframes
- Vertical separators - synced with NY time
Hot keys - keyboard shortcuts
- Q / W / E - Rectangle hot keys - fully customizable settings for each rectangle
- P / O / I - Horizontal lines hot keys - fully customizable settings for each Lines
- F - Optimal trade entry Fibonacci
- G - Dealing Range Fibonacci
Fair Value Gaps
- Visualize with just one click to the buttons
- choose current or up to 3 HTF timeframes
- Multi time frame visual ( example. Visualize M15,H1,H4 FVG while you are on M5)
- Set your lookback time, min and max gap size in points
- Set preferable colour for each TF FVG
Mobile notifications
- Set - Sent mobile notifications - True
- Set up your Metaquotes ID in Platform - Tools - Options - Notifications - insert your Metaquotes ID from your Mobile up and Allow push notifications
- Account name - option for setting own name for the notification on specific chart.
Default colours are well visible with the dark background charts, but obviously you can fully customize everything to your own preferences
If you need any help or have any questions don't hesitate to contact me before your purchase. Tool is used daily by more than 450 traders and works smoothly. I don't provide refunds for any reasons.Note: You are buying the trading indicator which helps you trade ICT / SMC approach. Not Mentorship, Trading Course or Signals...


Super. Combiné avec un autre indicateur que j'utilise au quotidien, mes entrées sont bien plus précises. Merci de bien vouloir m'inviter dans discord ou telegram.