Magic TD Sequential 9
- 指标
- Yin Zhong Peng
- 版本: 2.20
- 更新: 17 十月 2023
- 激活: 10
神奇九转 指标简介
九转序列(TD9),源自于TD序列(TD Sequential)。"神奇九转"是一种股票技术分析工具,它基于股价历史数据,通过将价格按照一定的数量级分割成九个等级,并计算每个等级的平均价格,进而构造出一个包含九个数据点的序列。这个序列被称为“神奇九转”,其中第一个数据点表示股票最低价,第九个数据点则表示股票最高价。
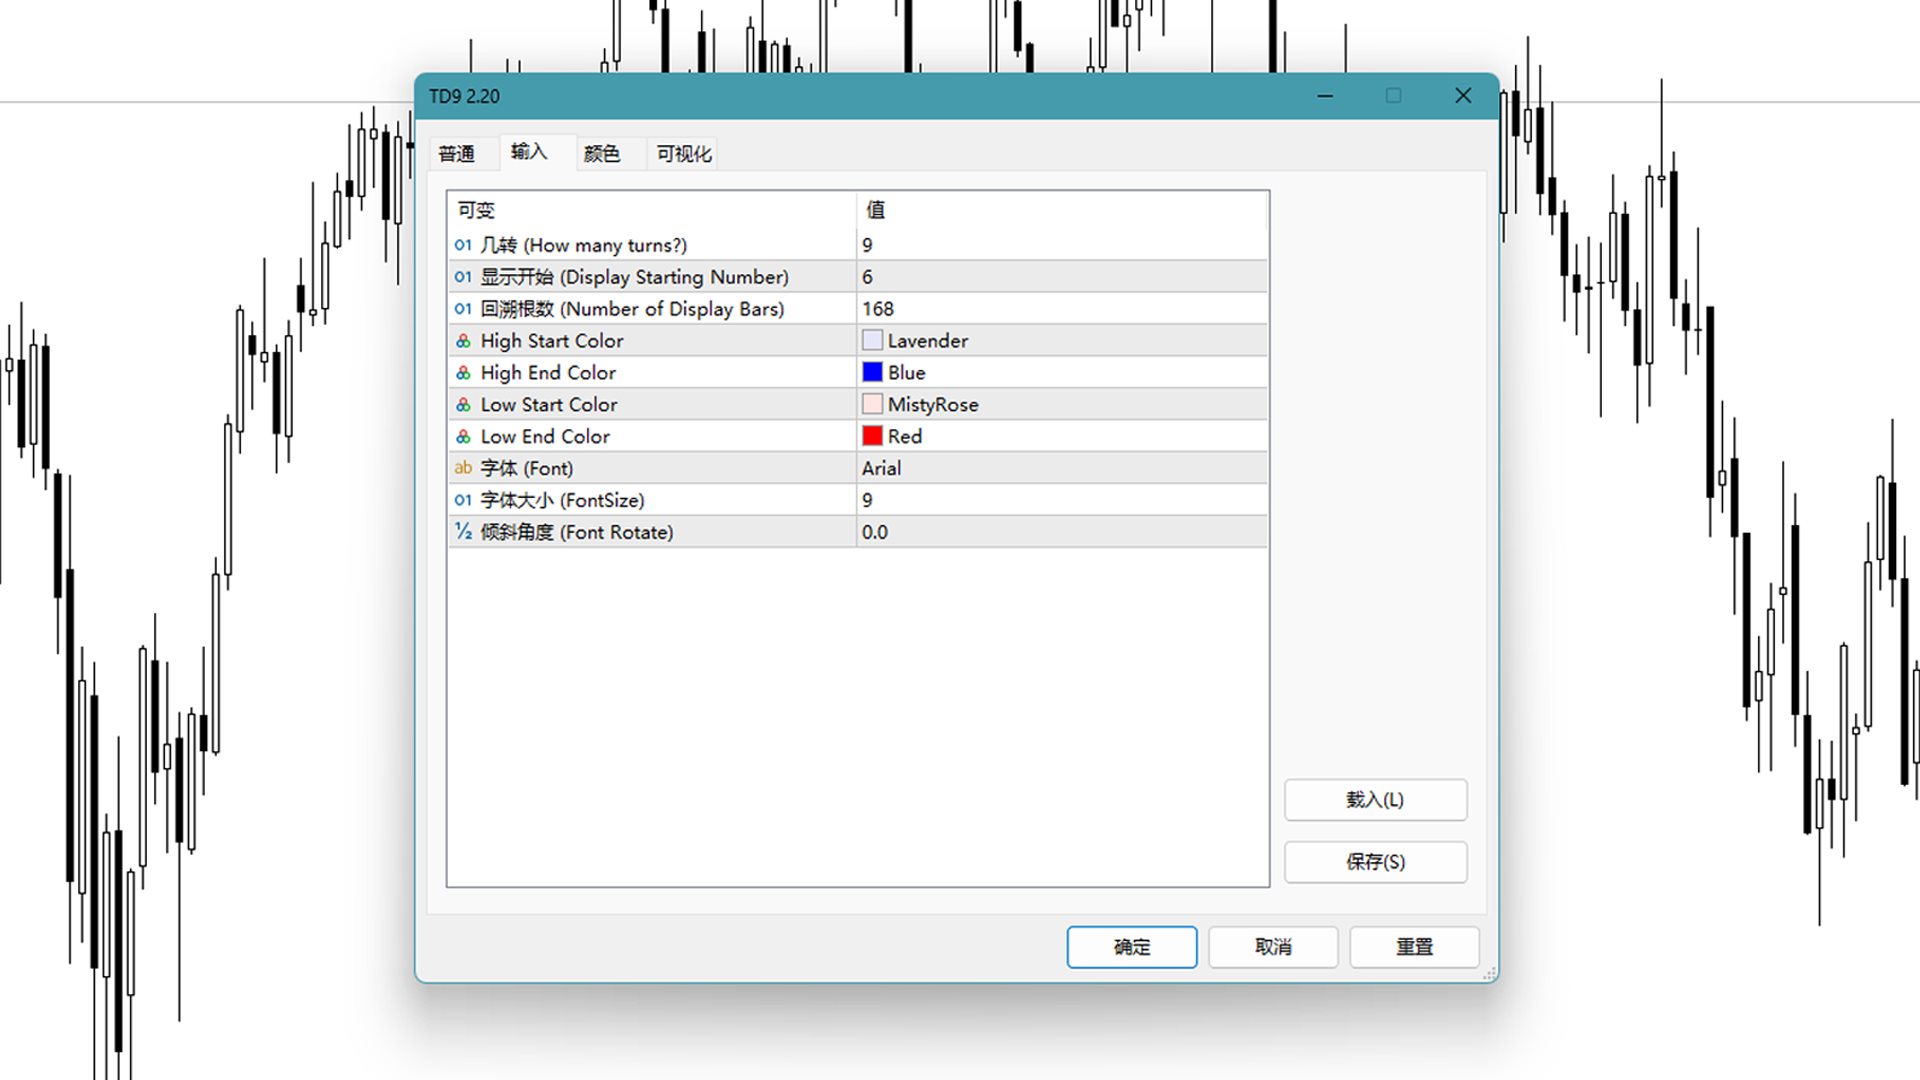
指标输入
1 几转:表示连续计数的最高值,从多少开始反转;
2 显示开始:表示从几开始显示出来;
3 回溯根数:表示要回测多少根K线;
4 Bghsc:表示K线上方的数字开始时显示的颜色;
5 Bghec:表示K线上方的数字结束时显示的颜色;(与上面的颜色产生渐变)
6 Bglsc:表示K线下方的数字开始时显示的颜色;
7 Bglec:表示K线下方的数字结束时显示的颜色;(与上面的颜色产生渐变)
8 字体
9 字体大小
10 文字旋转的角度
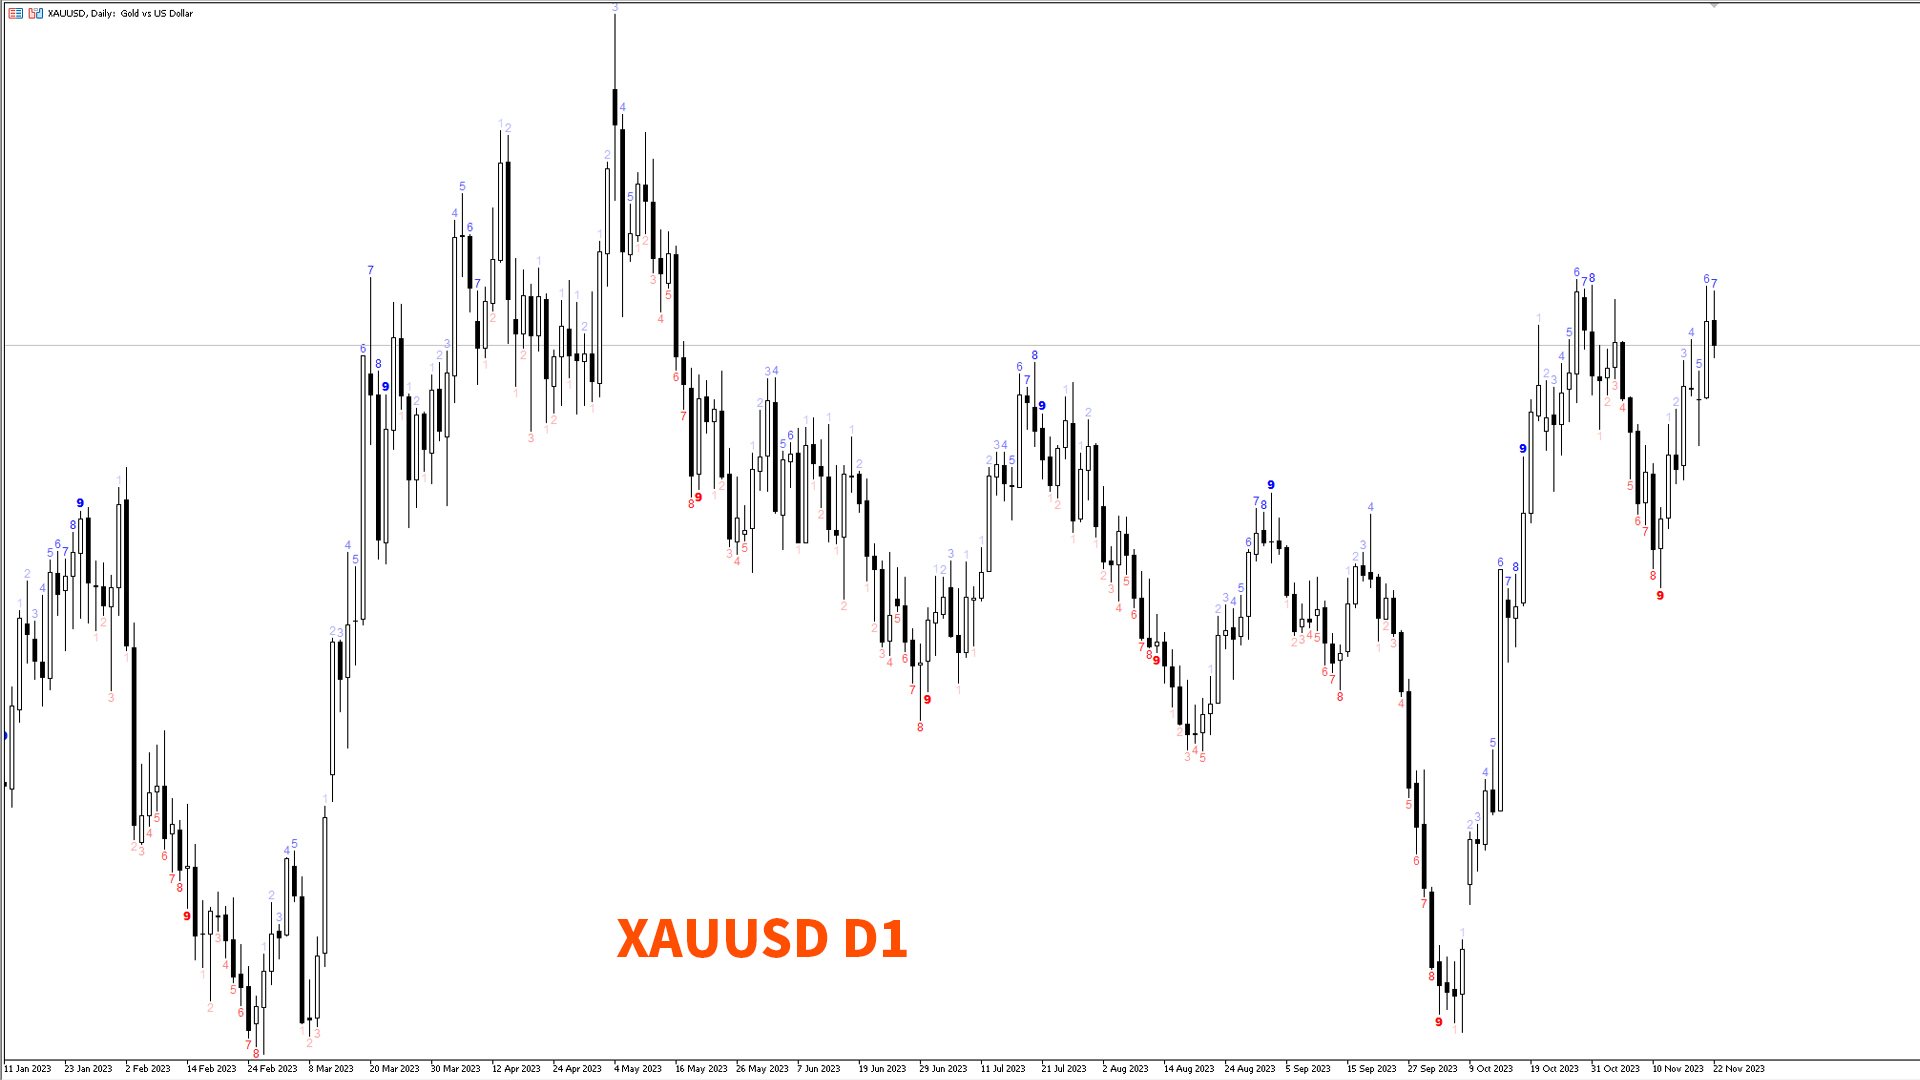
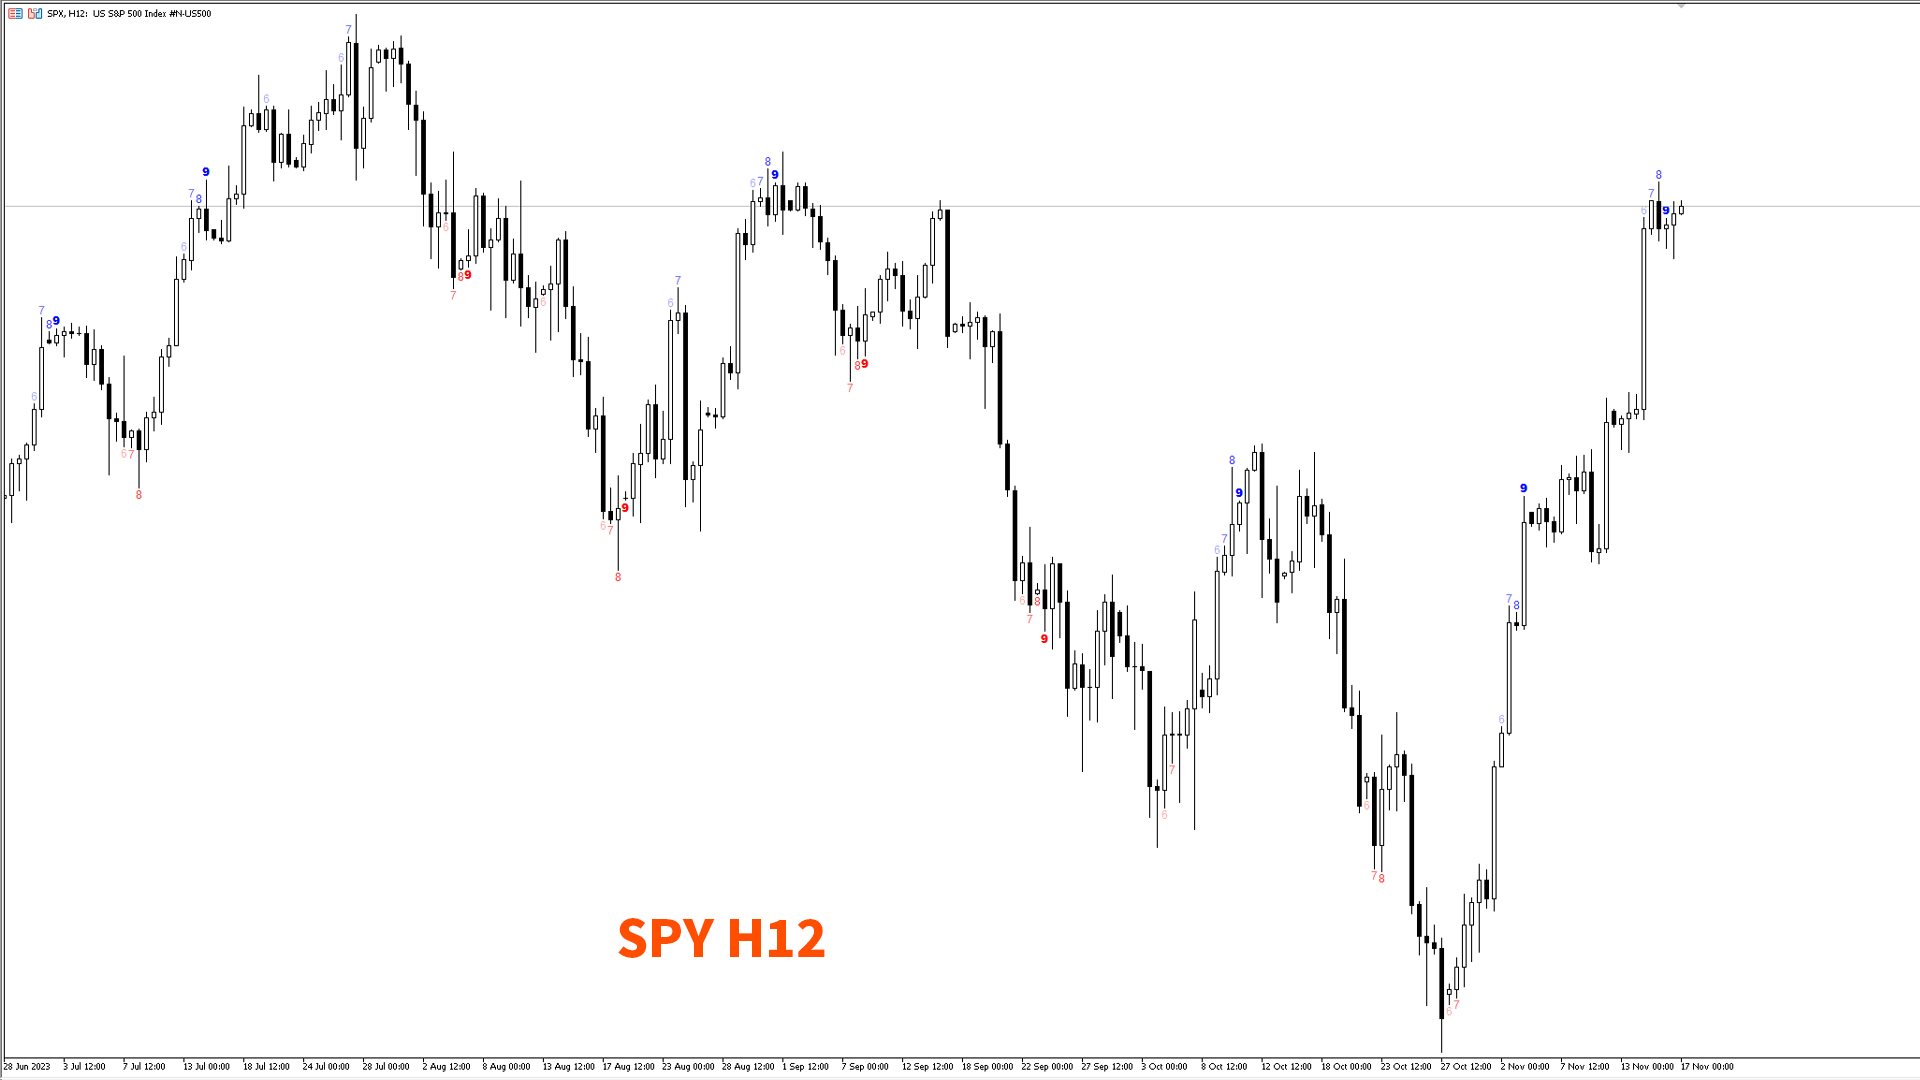
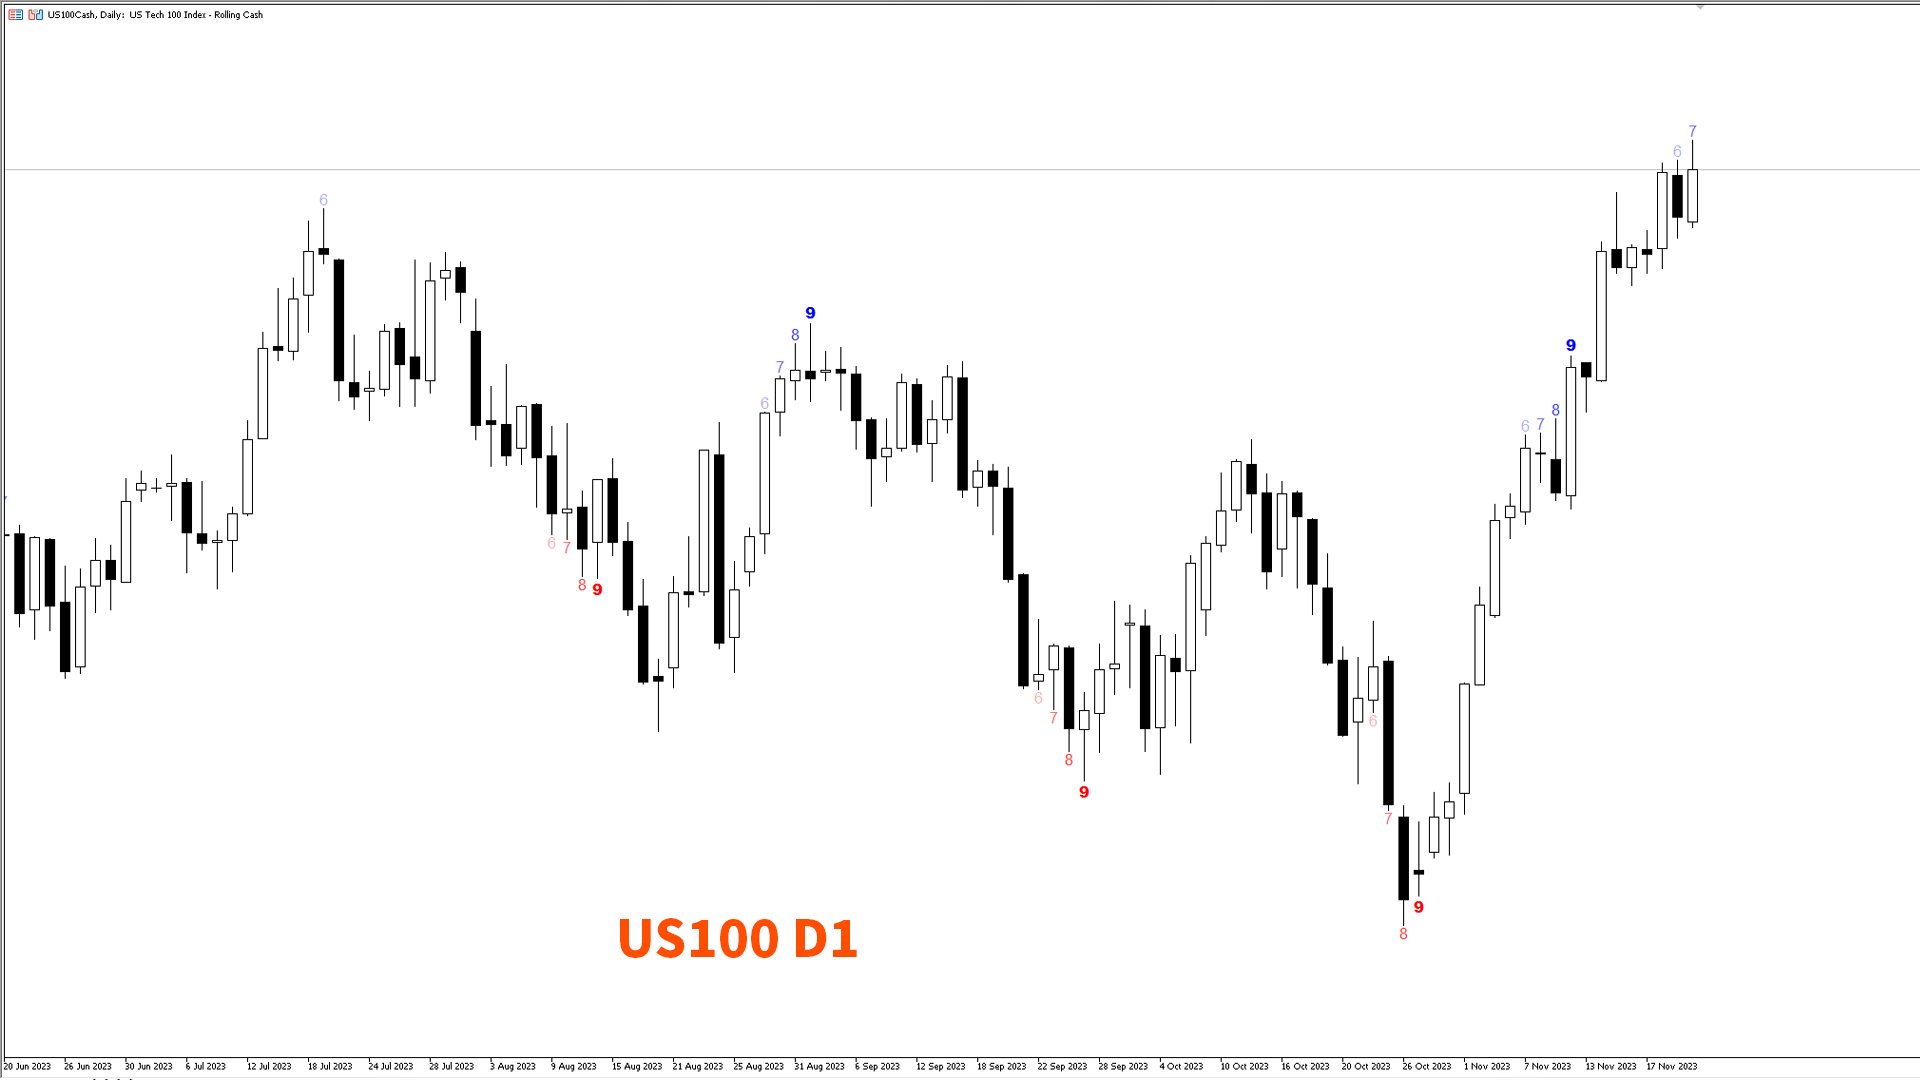
指标使用方法
使用神奇九转进行股票分析时,一般将当前股票价格与“九转”序列进行比较,以判断当前的价格水平是否处于极高或极低状态。如果当前价格远低于神奇九转中的第一或第二个数据点,很可能是买入时机;反之,如果价格远高于第八或第九个数据点,则可能是卖出时机。神奇九转是一种简单实用的股票分析工具,但需要注意的是,它只能作为一个辅助手段,不能单独作为投资决策的基础。