ZigZag with Extras for MT5
- 指标
- Fernando Carreiro
- 版本: 2.0
- 激活: 20
(谷歌翻译)
该指标基于作为源代码示例提供的原始 ZigZag 以及 MetaTrader 安装。
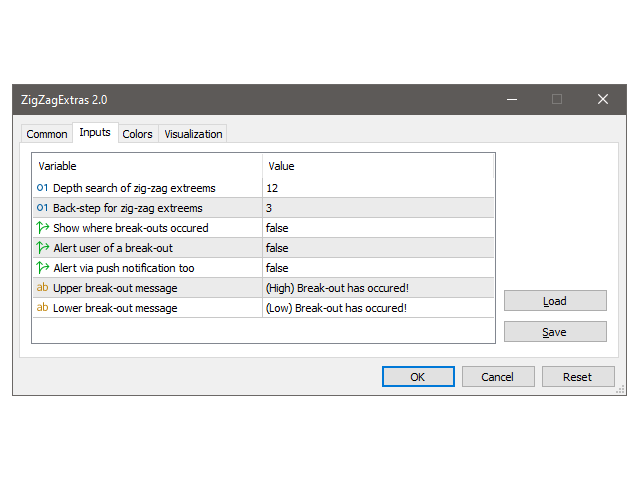
我用一些额外的功能重写了它,用于显示“深度”通道和相应的突破。 它还允许人们观察先前的之字形点。
可选地,它可以在发生突破时提醒用户。 警报可以简单地在终端上,也可以通过移动设备上的推送通知,使用您自己的自定义文本。
(谷歌翻譯)
該指標基於作為源代碼示例提供的原始 ZigZag 以及 MetaTrader 安裝。
我用一些額外的功能重寫了它,用於顯示“深度”通道和相應的突破。 它還允許人們觀察先前的之字形點。
可選地,它可以在發生突破時提醒用戶。 警報可以簡單地在終端上,也可以通過移動設備上的推送通知,使用您自己的自定義文本。
(Original text)
This indicator is based on the original ZigZag provided as a source code example with MetaTrader installations.
I rewrote it with some extra features for displaying the “depth” channel and the respective break-outs. It also allows one to observe prior zig-zag points.
Optionally, it can alert the user when break-outs occur. The alerts can be simply on the terminal or also via push notifications on a mobile device, with your own custom text.
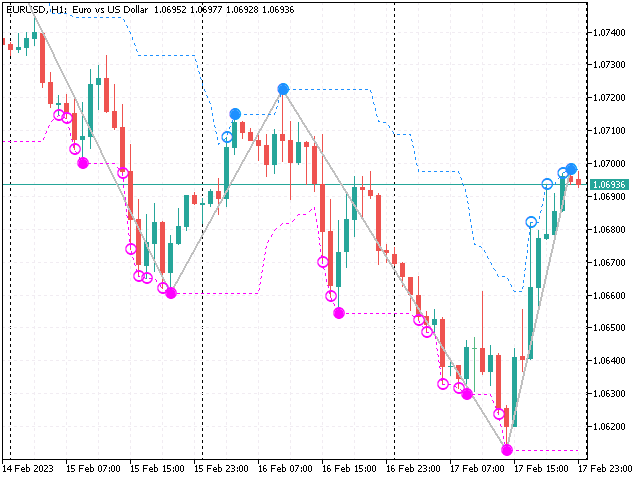


This was fun to run in the strategy tester. I would actually say that this could be one of the strongest signal indicators out there. The zig zag alone famously repaints, but this version may actually alert you at the point of divergence along with a useful trailing stop/trend line