The Th3Eng PipFinite indicator is based on a very excellent analysis of the right trend direction with perfect custom algorithms. It show the true direction and the best point to start trading. With StopLoss point and Three Take Profit points. Also it show the right pivot of the price and small points to order to replace the dynamic support and resistance channel, Which surrounds the price. And Finally it draws a very helpful Box on the left side on the chart includes (take profits and Stop loss
Improved version of the free HMA Trend indicator (for MetaTrader 4) with statistical analysis. HMA Trend is a trend indicator based on the Hull Moving Average (HMA) with two periods. HMA with a slow period identifies the trend, while HMA with a fast period determines the short-term movements and signals in the trend direction.
The main differences from the free version: Ability to predict the probability of a trend reversal using analysis of history data. Plotting statistical charts for analyz
The indicator generates early signals basing on ADX reading data combined with elements of price patterns. Works on all symbols and timeframes. The indicator does not redraw its signals. You see the same things on history and in real time. For better visual perception signals are displayed as arrows (in order not to overload the chart).
Features Easy to use. Filter configuration only requires selection of sensitivity in the " Sensitivity of the indicator " input.
Signals can be filtered usin
Noize Absorption Index - is the manual trading system that measures the difference of pressure between bears forces and bulls forces. Green line - is a noize free index that showing curent situation. Zero value of index shows totally choppy/flat market.Values above zero level shows how powerfull bullish wave is and values below zero measures bearish forces.Up arrow appears on bearish market when it's ready to reverse, dn arrow appears on weak bullish market, as a result of reverse expectation. S
This is a trend indicator without redrawing Developed instead of the binary options strategy (by the color of the Martingale candlestick) Also works well in forex trading When to open trades (binary options) A signal will appear in the place with a candle signaling the current candle It is recommended to open a deal for one candle of the current timeframe M1 and M5 When a blue dot appears, open a deal up When a red dot appears, open a trade down. How to open trades on Forex. When a signal is rec
The indicator displays the data of the Stochastic oscillator from a higher timeframe on the chart. The main and signal lines are displayed in a separate window. The stepped response is not smoothed. The indicator is useful for practicing "manual" forex trading strategies, which use the data from several screens with different timeframes of a single symbol. The indicator uses the settings that are identical to the standard ones, and a drop-down list for selecting the timeframe.
Indicator Parame
Chart Patterns Detect 15 patterns (Ascending Triangle, Descending Triangle, Rising Wedge, Falling Wedge, Bullish Flag, Bearish Flag, Bullish Rectangle, Bearish Rectangle Symmetrical triangle, Head and Shoulders, Inverted Head and Shoulders, Triple top, Triple Bottom, Double Top, Double Bottom) Use historical data to calculate the probability of each pattern to succeed (possibility to filter notification according to the chance of success) gives graphic indication about the invalidation level and
Alpha Trend is a trend indicator for the MetaTrader 4 platform; it has been developed by a group of professional traders. The Alpha Trend indicator finds the most probable tendency reversal points, which allows making trades at the very beginning of a trend. This indicator features notifications, which are generated whenever a new signal appears (alert, email, push-notification). This allows you to open a position in a timely manner. Alpha Trend does not redraw, which makes it possible to evalua
Signal trend indicator.
Detects the direction of the trend and is coloured accordingly.
Has built in audible and visual alerts when trends change.
Can send notifications to your phone or email.
Allows Trend and Counter-Trend trading.
Works on all timeframes, all currency pairs, metals, indices and cryptocurrencies.
Can be used with binary options.
Distinctive features No re-drawing; Simple and clear settings; Four types of alerts; Works on all timeframes and all trading tools; Su
The Stepping Trend Indicator
The Steppi ng Trend indicator uses the average true range (ATR indicator) in its calculation. This gives you control to set your own average true range period, I set the Default as 10.
Indicator Details.
Green Arrow Up: This means you are at the starting point of a new bullish trend, it’s time to buy. Red Arrow Down : This means you are at the starting point of a new bearish trend, it’ s time to sell .
What if you miss the Arrow Signal?
No
This indicator is good for small time frames like 1 and 5 minutes and made for day trading. The indicator never repaints or recalculates. The indicator works is for trading swing points in day trading, following bulls or bears. Its a simple to use, non cluttered indicator with a high success rate. This indicator works well to capture ranges. All indicators come with limitations and no indicator or system is always accurate. Use money management for long term trading success. Place in backte
Heiken Ashi candle chart is an improved version of The Japanese candle chart, which can effectively filter the market "noise" of the Japanese candle chart. It is favored by many traders for its simplicity and intuition. For trend traders, the HA candle chart is a magic tool. Unlike the traditional Japanese candle chart, Heikenashi does not reflect the opening price, high price, low price and closing price of the market. Instead, Heikenashi calculates the value of a single K line in the dominant
Gvs Undefeated Trend indicator is designed for trend and signal trading. This indicator generates trend signals. It uses many algorithms and indicators to generate this signal. It tries to generate a signal from the points with the highest trend potential. This indicator is a complete trading product. This indicator does not need any additional indicators. You can only trade with this indicator. The generated signals are displayed on the graphical screen. Thanks to the alert features you ca
Breakthrough Solution For Trend Trading And Filtering With All Important Features Built Inside One Tool! Trend PRO's smart algorithm detects the trend, filters out market noise and gives entry signals with exit levels. The new features with enhanced rules for statistical calculation improved the overall performance of this indicator.
Important Information Revealed Maximize the potential of Trend Pro, please visit www.mql5.com/en/blogs/post/713938
The Powerful Expert Advisor Version
Automa
"The trend is your friend" is one of the best known sayings in investing, because capturing large trendy price movements can be extremely profitable. However, trading with the trend is often easier said than done, because many indicators are based on price reversals not trends. These aren't very effective at identifying trendy periods, or predicting whether trends will continue. We developed the Trendiness Index to help address this problem by indicating the strength and direction of price trend
The Riko Trend indicator is a revolutionary trend trading and filtering solution with all the important features of a trend tool built into one tool! The Riko Trend indicator is good for any trader, suitable for any trader for both forex and binary options. You don’t need to configure anything, everything is perfected by time and experience, it works great during a flat and in a trend.
The Riko Trend indicator is a technical analysis tool for financial markets that reflects the current price
What are Heiken Ashi Candles?
Heiken Ashi, derived from the Japanese term 'Heikin Ashi,' translates to average price bars. It's an indicator depicting price bars on a chart.
Formula for Heiken Ashi candles:
- Heiken Ashi opening price: (previous candle's opening + closing price) / 2 - Closing price Heiken Ashi: (opening + high + low + closing) / 4 - Heiken Ashi peak: Max of high, opening, or closing price - Heiken Ashi bottom price: Min of low, opening, or closing price
How to Read Heik
Master Scalping M1 is an innovative indicator that uses an algorithm to quickly and accurately determine the trend.The indicator calculates the time of opening and closing positions, the indicator's algorithms allow you to find the ideal moments to enter a deal (buy or sell an asset), which increase the success of transactions for most traders. Benefits of the indicator: Easy to assemble, does not overload the chart with unnecessary information. Can be used as a filter for any strategy. Works on
Taurus All4
Taurus All4 is a high-performance indicator, it will tell you the strength of the trend, and you will be able to observe the strength of the candle. Our indicator has more than 4 trend confirmations.
It is very simple and easy to use.
Confirmation Modes Candle Trend Confirmations: When the candle switches to light green the trend is high. When the candle switches to light red the trend is reverting down. When the candle changes to dark red the trend is low. Trendline Trend Conf
An indicator of pattern #31 ("Long Island") from Encyclopedia of Chart Patterns by Thomas N. Bulkowski. The second gap is in the opposite direction.
Parameters: Alerts - show alert when an arrow appears Push - send a push notification when an arrow appears (requires configuration in the terminal) GapSize - minimum gap size in points ArrowType - a symbol from 1 to 17 ArrowVShift - vertical shift of arrows in points ShowLevels - show levels ColUp - color of an upward line ColDn - color of
Trade with Gann on your side!! MASTER CIRCLE 360 CIRCLE CHART, originally created by Gann admitted that this is “The Mother of all charts”. It is one of the last studies that this great trader left for us. The numeric tab le is apparently quite simple like all the tables and is based on square numbers, the SQUARE OF 12 and is by evolution, one of the most important square numbers. Here we can find CYCLE, PRICE AND TIME thanks to angles and grades, to show past and future support and resistance.
The indicator shows the potential trend direction by cyclical-wave dependence. Thus, all the rays of the intersection will be optimal rays, in the direction of which the price is expected to move, taking into account the indicator period. Rays can be used as a direction for potential market movement. But we must not forget that the approach must be comprehensive, the indicator signals require additional information to enter the market.
About the Lyne indicator
Lyne is a Metatrader 4 (MT4) indicator, the essence of which is to transform the accumulated historical data.
The Lyne indicator makes it possible to detect various features and patterns in price dynamics that are invisible to the naked eye.
Based on this information, traders can anticipate further price movement and adjust their strategy accordingly.
This indicator has proven itself in the scalping strategy. The indicator works without repainting.
A key element in trading is zones or levels from which decisions to buy or sell a trading instrument are made. Despite attempts by major players to conceal their presence in the market, they inevitably leave traces. Our task was to learn how to identify these traces and interpret them correctly. Reversal First Impulse levels (RFI) - Version MT5 INSTRUCTIONS RUS ENG R ecommended to use with an indicator -
TPSpro TRENDPRO - is a trend indicator that automatically analyzes the market and provides information about the trend and each of its changes, as well as giving signals for entering trades without redrawing! The indicator uses each candle, analyzing them separately. referring to different impulses - up or down impulse. Exact entry points into transactions for currencies, crypto, metals, stocks, indices! - Version MT5 DETAILED DESCRIPTION / TRADING SETUPS
You can visually backtest Break & Retest to see how it behaved in the past!
Manual guide: Click here
$65 for only 1 copy left! Next price is $120 .
This Indicator only places quality trades when the market is really in your favor with a clear break and retest. Patience is key with this price action strategy! Recommended timeframes: M1 for Scalpers. M15 for Intraday traders. H1 & H4 for Day traders. Other timeframes are also excellent!
After many months of hard w
on free demo press zoom out button to see back.. cnt number is bar numbers.you can change up to 3000 related to chart bars numbers. minimum value is 500. there is g value set to 1.01. no need to change it.
this indicator almost grail,no repaint and all pairs ,all timeframe indicator. there is red and blue histograms. if gold x sign comes on red histogram that is sell signal. if blue x sign comes on blue histogram that is buy signal. this indicator on thise version works all pairs.al timeframes
Thise indicator is up down v6 comes with tradingwiev pinescript. purchased people, after installed on terminal ,contact me on mql5 to get BONUS TradingView pinescript.
up-down indicator is no repaint and works all pairs and lower than weekly time frames charts. it is suitable also 1 m charts for all pairs. and hold long way to signal. dont gives too many signals. when red histogram cross trigger line that is up signal.and price probably will down when blue histogram cross trigger line that
PRO Renko Arrow Based System for trading renko charts. 准确的信号交易任何外汇工具. 另外,我将免费提供系统的附加模块! PRO Renko系统是RENKO图表上高度准确的交易系统。该系统是通用的。 该交易系统可应用于各种交易工具。 该系统有效地中和了所谓的市场噪音,打开了获得准确反转信号的通道。 该指标易于使用,只有一个参数负责产生信号。 您可以很容易地使算法适应您感兴趣的交易工具和renko酒吧的大小。 我很乐意通过提供任何咨询支持来帮助所有客户有效地使用该指标。 祝您交易成功!购买后,立即写信给我! 我将与您分享我的建议和我的renko发电机。 另外,我将免费提供系统的附加模块!
Symbols must be separated by commas (,) and entered into the parameters exactly as displayed by your broker to ensure they are recognized in the dashboard. These symbols will be used for analysis by the indicator.
With one click open any pair any timeframe directly from dashboard The MA Speedometer Dashboard is a highly functional MetaTrader 4 (MT4) indicator designed to enhance trading strategies through dynamic market analysis. It offers robust features for identifying market trends, trading
note: this indicator is for METATRADER4, if you want the version for METATRADER5 this is the link: https://www.mql5.com/it/market/product/108106 TRENDMAESTRO ver 2.4 TRENDMAESTRO recognizes a new TREND in the bud, he never makes mistakes. The certainty of identifying a new TREND is priceless. DESCRIPTION TRENDMAESTRO identifies a new TREND in the bud, this indicator examines the volatility, volumes and momentum to identify the moment in which there is an explosion of one or more of these data a
IX Power 终于将 FX Power 的无与伦比的精确性带到了非外汇交易符号中。
它能准确判断您喜爱的指数、股票、商品、ETF 甚至加密货币的短期、中期和长期趋势强度。
您可以 分析 终端提供的 一切 。试试吧,体验一下您在交易时如何把握 时机 。
IX Power 主要功能
100% 精确的非重绘计算结果 - 适用于您终端中的所有交易符号 下拉式选择预配置以及可单独配置的强度分析周期 通过电子邮件、消息和手机通知的无数种通知选项
可访问的 EA 请求缓冲区 可自定义计算限制,以获得更好的性能
为希望查看更多信息的用户提供特殊的多实例设置 无尽的图形设置,让您在每个图表中都能找到最喜欢的颜色
采用 Windows 11 和 macOS 风格的圆角新面板设计
神奇的移动指标面板,可在子窗口和主图表之间无缝移动 适用于高分辨率 QHD、UHD 和 4K 显示器,并针对平板电脑和触摸屏进行了优化
IX Power 参数 最重要的参数不言自明,但我们很快会在另一篇文章中为您提供所有 IX Power 参数的完整说明。
使用别名 "参数可为技术交易
通过 mql5 和 Telegram 上 的晨间简报获取每日市场更新,包括详细信息和屏幕截图 ! FX Power MT4 NG 是我们长期以来非常受欢迎的货币强度计算器 FX Power 的下一代产品。 这款下一代强度计算器能提供什么?您所喜爱的原版 FX Power 的所有功能 附加功能 黄金/XAU 强度分析 更精确的计算结果 可单独配置的分析周期 可自定义计算限制,以获得更好的性能 为希望查看更多信息的用户提供特殊的多实例设置 无尽的图形设置,可在每个图表中设置您最喜欢的颜色 无数的通知选项,让您再也不会错过任何重要信息 采用 Windows 11 和 macOS 风格的全新圆角设计 神奇的移动指标面板
FX Power 主要功能 所有主要货币的完整强势历史 所有时间框架内的货币强弱历史 所有经纪商和图表的计算结果完全相同 100% 可靠的实时计算 -> 无重绘 可通过下拉列表选择分析时段
通过自定义模式单独配置分析时段 可在一个图表中使用多个实例 可移动 FX Power 显示屏(通过拖放) 适用于高分辨率 QHD、UHD 和 4K 显示器 自动终端配置 针对平板电脑
77% discount for the next 10 buyers (original price $605): 1 left
3 Indicators in 1 indicator
Strategy based on price action
Made specifically for the best forex currency pairs
Can be used in the best time frame of the market
at a very reasonable price This indicator is basically 3 different indicatos . But we have combined these 3 indicators in 1 indicator so that you can use 3 indicators at the lowest price.
All three strategies are based on price action. But based on different trends.
This indicator is unstoppable when combined with our other indicator called Katana. After purchase, send us a message and you could get Katana for FREE as a BONUS After purchase, send us a private message for your instructions.
MT5 version: click here
3 copies left available at $45. Next price is $95. Don't miss this great deal!
The Trend Forecasting indicator is a very unique & easy tool that is able to make prediction about future price movement based on the signals generated
An exclusive indicator that utilizes an innovative algorithm to swiftly and accurately determine the market trend. The indicator automatically calculates opening, closing, and profit levels, providing detailed trading statistics. With these features, you can choose the most appropriate trading instrument for the current market conditions. Additionally, you can easily integrate your own arrow indicators into Scalper Inside Pro to quickly evaluate their statistics and profitability. Scalper Inside
The indicator displays the size of the spread for the current instrument on the chart. Very flexible in settings. It is possible to set the maximum value of the spread, upon exceeding which, the color of the spread label will change, and a signal will sound (if enabled in the settings). The indicator will be very convenient for people who trade on the news. You will never enter a trade with a large spread, as the indicator will notify you of this both visually and soundly. Input parameters: Aler
The indicator displays the size of the spread for the current instrument on the chart. Very flexible in settings. It is possible to set the maximum value of the spread, upon exceeding which, the color of the spread label will change, and a signal will sound (if enabled in the settings). The indicator will be very convenient for people who trade on the news. You will never enter a trade with a large spread, as the indicator will notify you of this both visually and soundly. Input parameters: Aler
The MaxMinTrend indicator displays the highs and lows of the price on the chart. This indicator was created to simplify the determination of trend directions, as well as to support open positions, by transferring Stoploss to the current highs and lows of the price, thereby making a large profit. This indicator is not redrawn.
Input parameters:
BarsCount - 1000 - Number of bars to draw the indicator
maxmin - true - Enabled display of Highs and Lows
line - true - Enabled display of the co
The Flat Horizontal Channel Range Price indicator automatically draws a horizontal channel (range) of prices on a higher or current timeframe. This indicator was developed to simplify the determination of sideways movements of the market, as well as to search for entry signals for a pullback from the boundaries of a channel (range) or for its breakdown.
Input parameters:
BarsCount - 1000 - Number of bars to search for a horizontal channel AutoPeriodDraw - true - Enabled automatic drawing of
The indicator is designed to display candles (bars) of a higher timeframe on the current one. The indicator has many settings for the displayed candles, as well as a sound signal that will sound a few minutes (seconds) before the bar closes. Input parameters: BarsCount = 50 - the number of displayed bars of the higher timeframe Auto_Candle_UP_TF = false - Automatic selection of a higher timeframe Candle_UP_TF = 60 - Higher timeframe, if Auto_Candle_UP_TF = false Signal_Close_Candle_UP_TF = fals
The Trend Reversal Arrow Scalper indicator is designed to find trend reversals on the current timeframe. Trading with it becomes very simple, since the indicator does all the hard work for you to find points of entry into the market. You just have to buy if a blue arrow appears, or sell if a red arrow appears. The indicator also displays dots (red and blue following the arrow). They show the current trend and are also signals for entry (if, for example, you missed the main entry along the arrow)
The MaxMinTrend indicator displays the highs and lows of the price on the chart. This indicator was created to simplify the determination of trend directions, as well as to support open positions, by transferring Stoploss to the current highs and lows of the price, thereby making a large profit. This indicator is not redrawn.
Input parameters:
BarsCount - 1000 - Number of bars to draw the indicator
maxmin - true - Enabled display of Highs and Lows
line - true - Enabled display of the co
The Flat Horizontal Channel Range Price indicator automatically draws a horizontal channel (range) of prices on a higher or current timeframe. This indicator was developed to simplify the determination of sideways movements of the market, as well as to search for entry signals for a pullback from the boundaries of a channel (range) or for its breakdown.
Input parameters:
BarsCount - 1000 - Number of bars to search for a horizontal channel AutoPeriodDraw - true - Enabled automatic drawing of
The indicator is designed to display candles (bars) of a higher timeframe on the current one. The indicator has many settings for the displayed candles, as well as a sound signal that will sound a few minutes (seconds) before the bar closes. Input parameters: BarsCount = 50 - the number of displayed bars of the higher timeframe Auto_Candle_UP_TF = false - Automatic selection of a higher timeframe Candle_UP_TF = PERIOD_H1 - Higher timeframe, if Auto_Candle_UP_TF = false Signal_Close_Candle_UP_TF
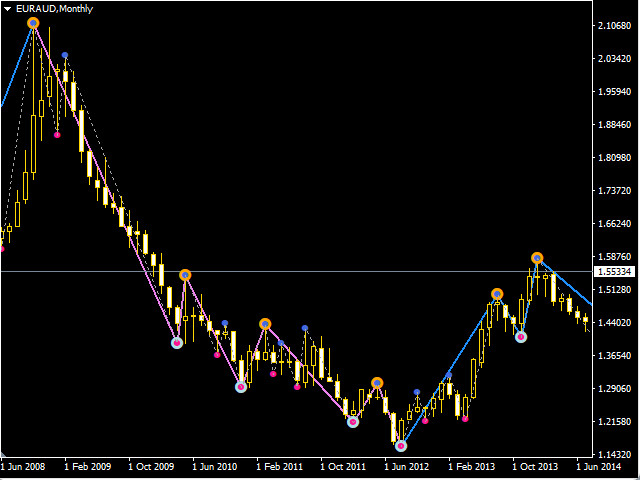
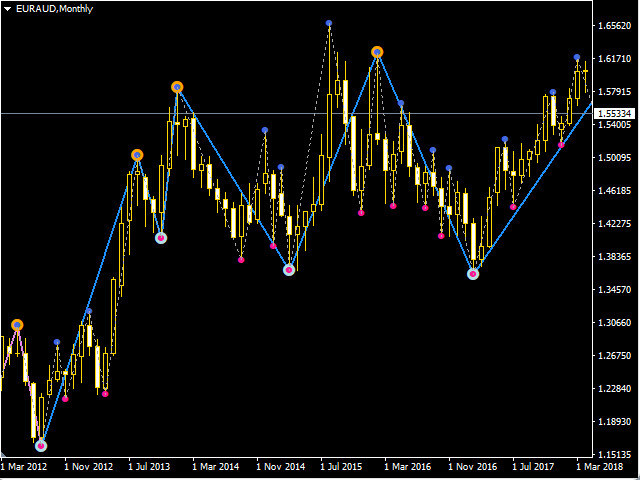
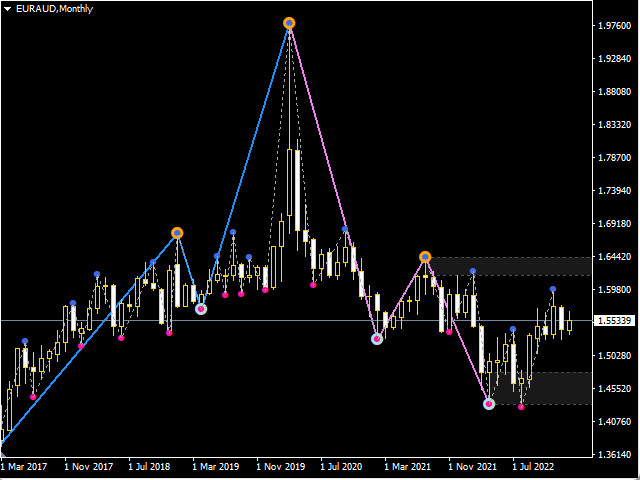
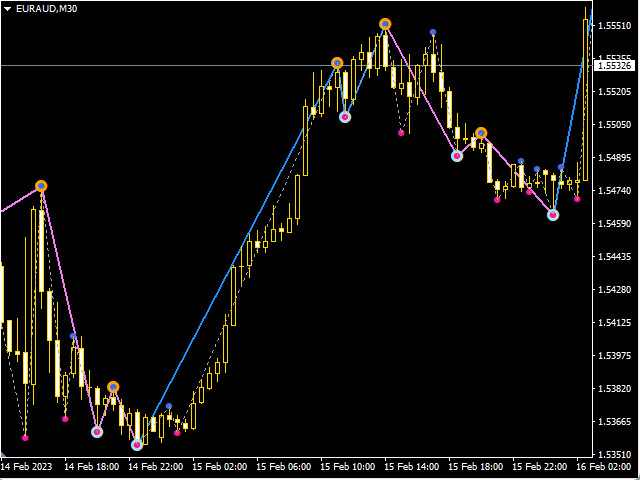
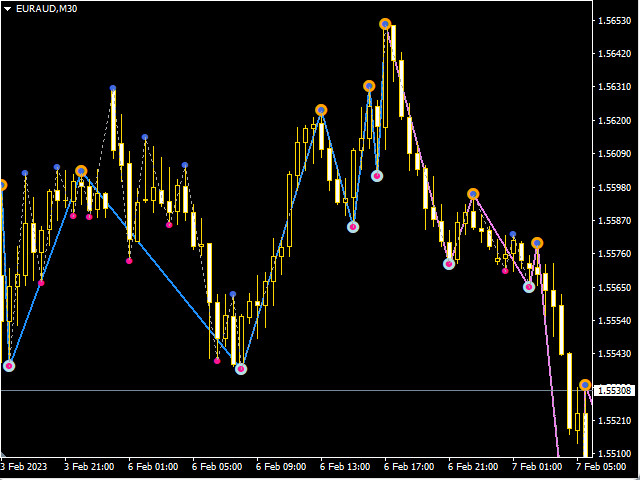
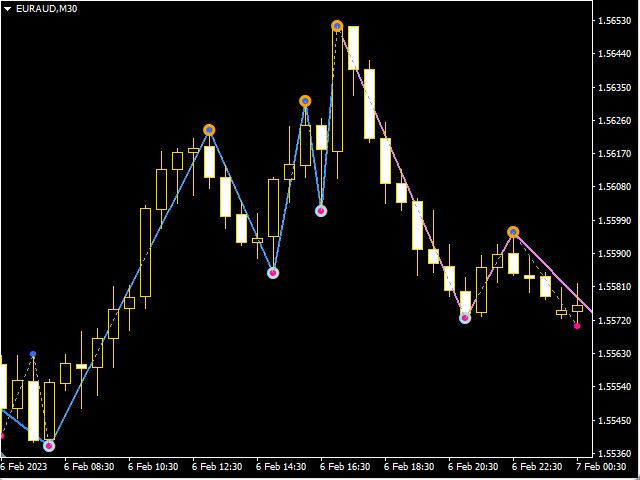
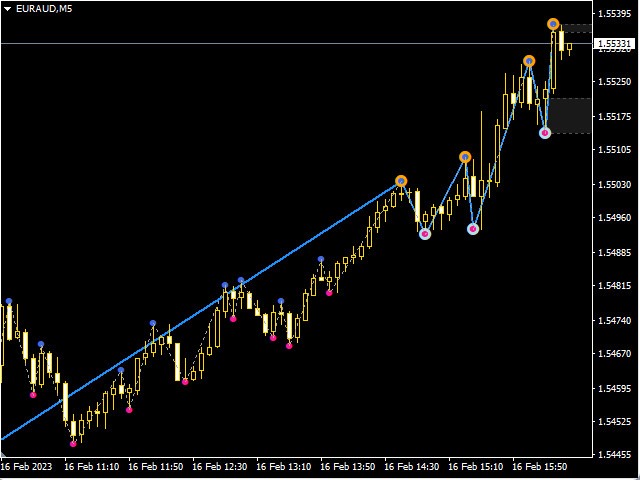
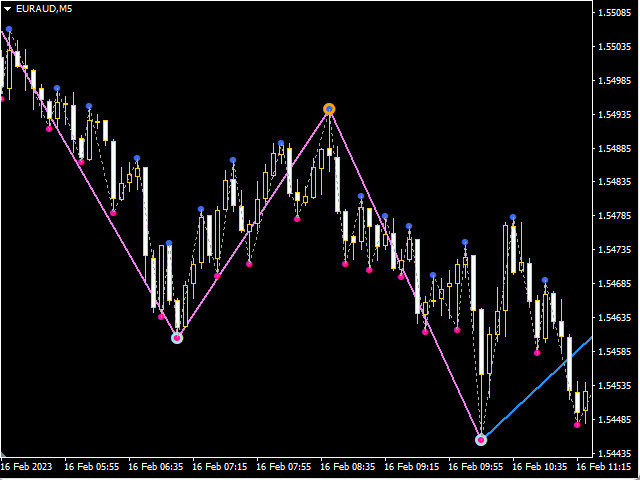
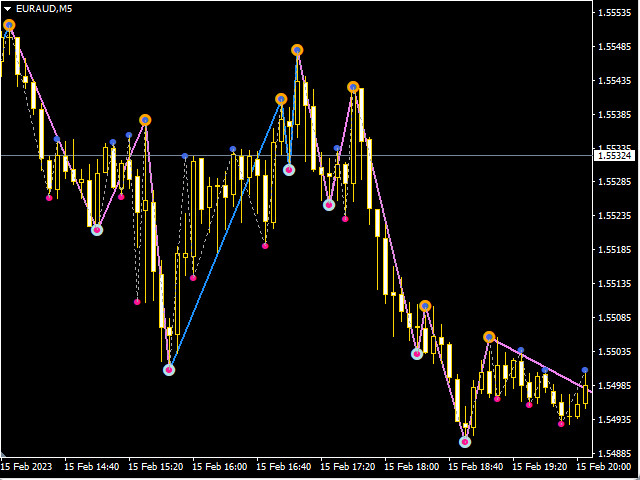
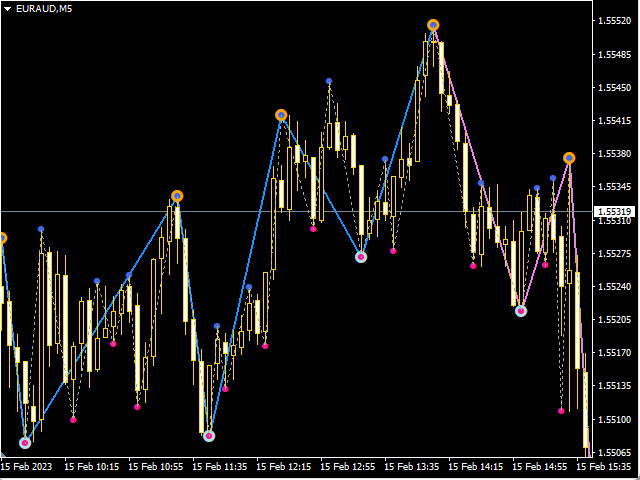
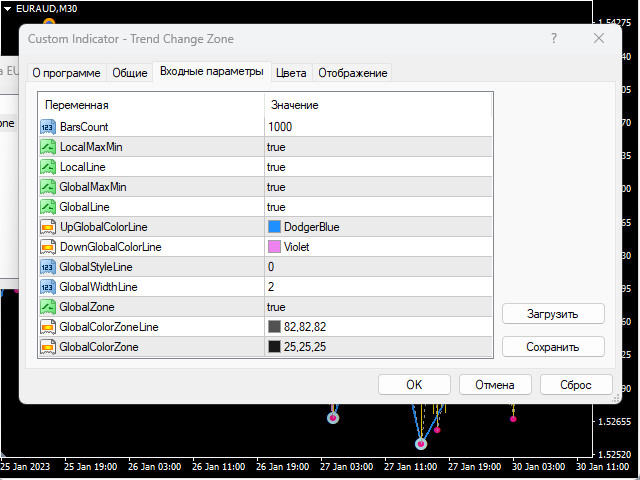
The TrendChangeZone indicator displays global and local price highs and lows on the chart. The indicator also shows the global trend on the chart and corrective waves. This indicator is designed to determine the direction and change the trend. Most importantly, the indicator shows trend continuation or reversal zones. An indispensable assistant in trading. The indicator does not redraw. The indicator can work on all trading instruments.
Important !!! Top trend if 2 (two) or more b