Equal Highs and Lows mt4
- 指标
- Barend Paul Stander
- 版本: 1.1
- 更新: 4 八月 2023
- 激活: 10
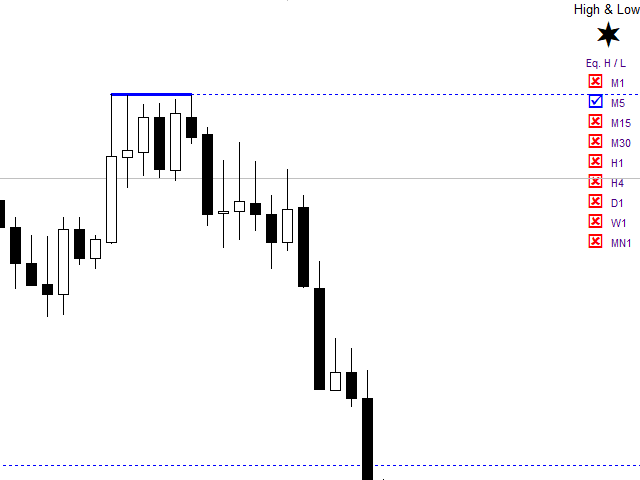
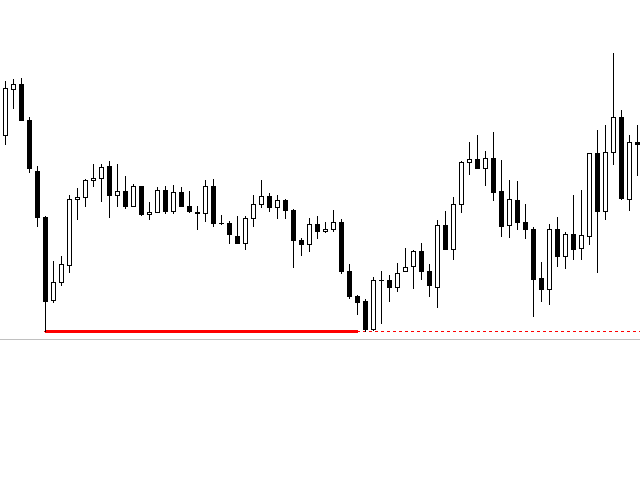
Equal Highs and Lows Indicator
Find and Mark Equal Highs and Lows on chart of Selected Multi Time frames.
Options:
- set min and max bars between Equal High's / Low's bars
- set max points difference between High's / Low's ( Sensitivity )
- Select time frames by buttons on chart
- Select / Filter only High's or Low's by a button
- Extend Equal High's / Low's line forward for chart reference

Very helpful indicator but would be better to buy Auto Orderblocks which includes this one too.