React Fibonacci Chart
- 指标
- Kim Yonghwa
- 版本: 1.5
- 更新: 23 十月 2023
功能
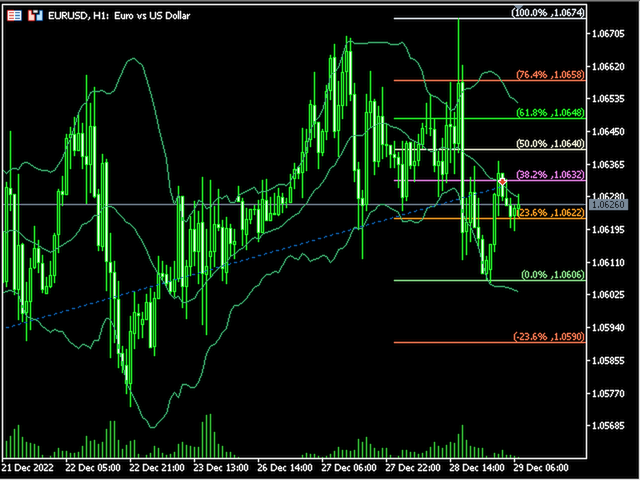
- 斐波那契回调交易指标
- 根据之前选择的1小时、4小时、1天和1周中的某个时间段绘制斐波那契图表。
- 当市场价格触及斐波那契水平时,颜色会变化,并显示触摸时间。
- 斐波那契图在-23.6、0、23.6、38.2、50、61.8、76.4、100和123.6水平绘制,当柱更新时,图表会刷新。
变量
- 时间框架:根据选择的1小时、4小时、1天和1周时间框架绘制斐波那契图表。
- FiboWidth:确定水平线的粗细。
- FiboStyle:设置枢轴水平线的样式。
- TouchedColor:触摸时变化的颜色。
如果您发现任何错误或希望看到改进,请发表评论。
评价对开发者非常有帮助。如果您满意,请给我们5星评价。
-----------------------


good