Gartley Hunter Multi
- 指标
- Siarhei Vashchylka
- 版本: 1.4
- 更新: 16 四月 2024
- 激活: 10
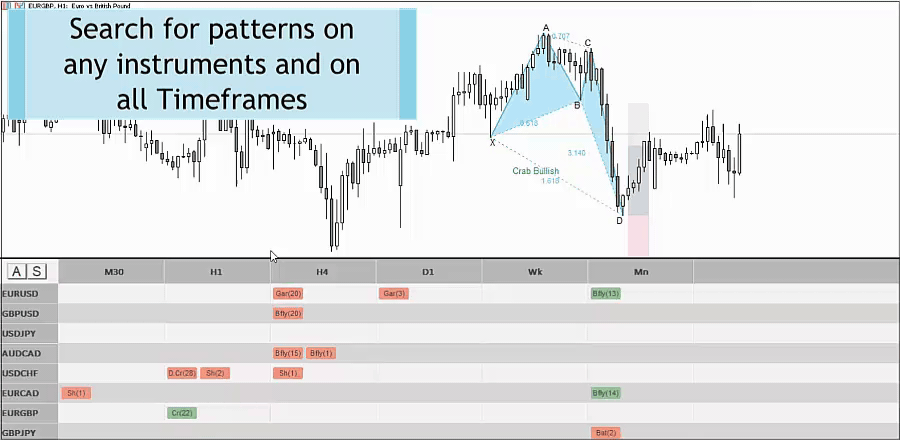
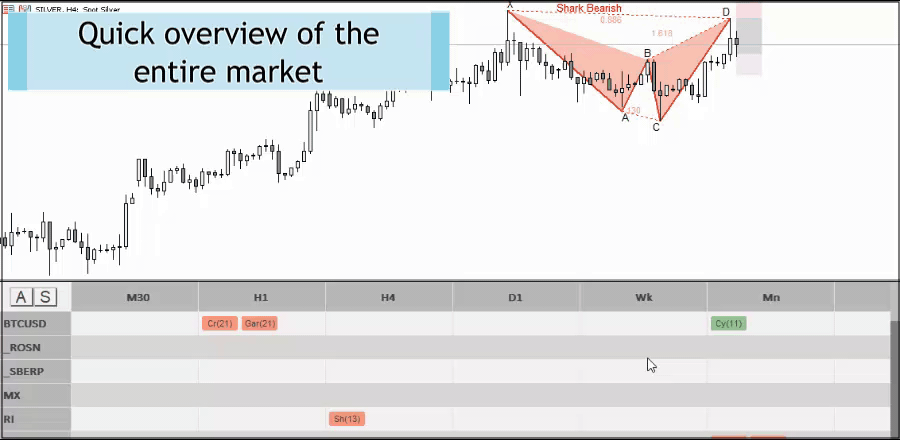
Gartley Hunter Multi - An indicator for searching for harmonic patterns simultaneously on dozens of trading instruments and on all classic timeframes: (m1, m5, m15, m30, H1, H4, D1, Wk, Mn).
Manual (Be sure to read before purchasing) | Version for MT4
Advantages
1. Patterns: Gartley, Butterfly, Shark, Crab. Bat, Alternate Bat, Deep Crab, Cypher
2. Simultaneous search for patterns on dozens of trading instruments and on all classic timeframes
3. Search for patterns of all possible sizes. From the smallest to the largest
4. All found patterns are placed in a table where you can quickly switch between them
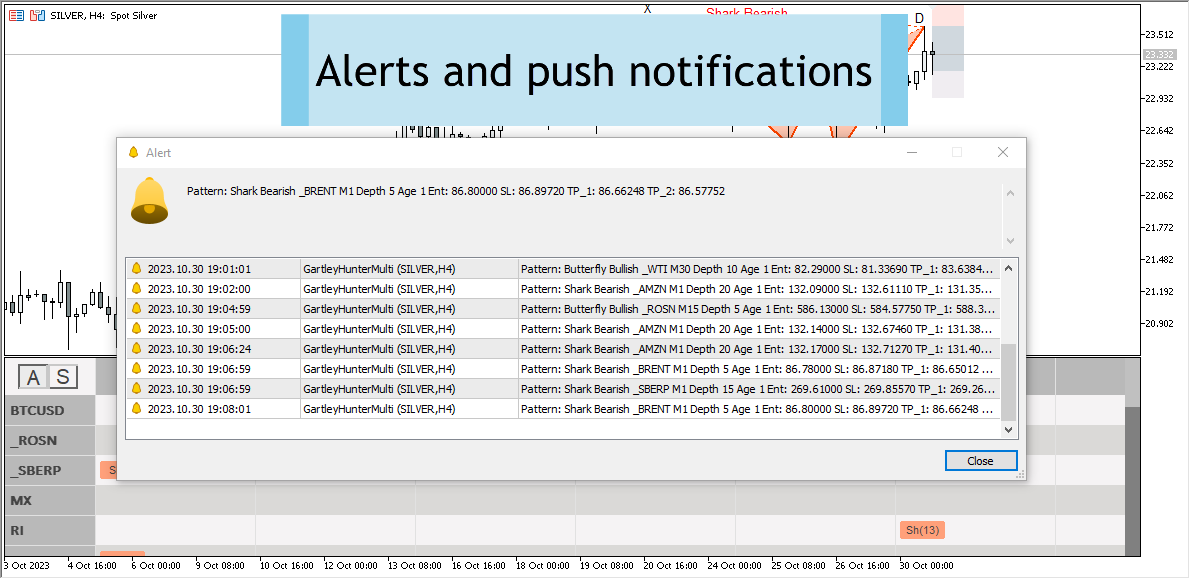
5. Advanced system of alerts and push notifications. When a pattern appears, the indicator will let you know about it


Author very prompt and open to suggestion added email alert upon request 5 stars!