• 概述
  • 评论
  • 评论 (14)
  • 新特性

Bull Bear Powers

Bull Bear Powers indicator shows the absolute power of bulls and bears in the market. Both powers are shown simultaneously with red and green colors for bear and bull powers respectively. When red line goes over the green line it means that bears are controlling the market. When green line goes over the red line it means that bulls are controlling the market. The green/red horizontal symbol line at the bottom of the indicators shows which party has more strength.

Time Frame: M30 and H1 are recommended (the indicator works on all time frames).

Signal:

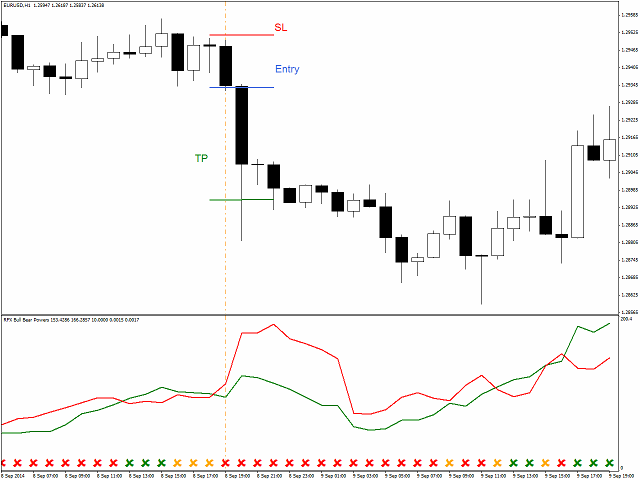
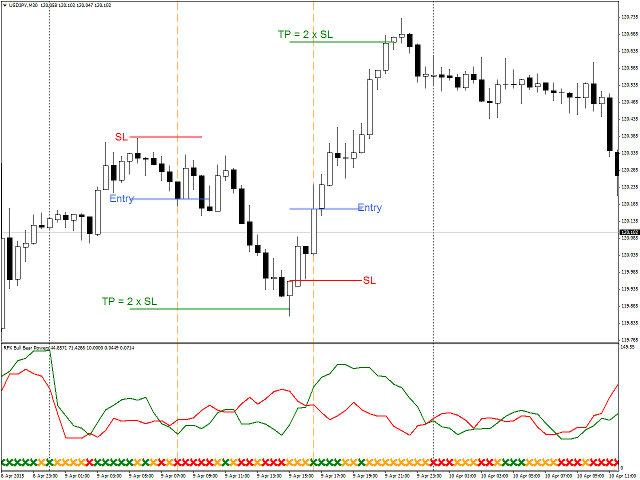
  • BUY: Buy when a significant but not extremely long bull candle appears at the beginning of a green horizontal symbol line at the bottom of the indicator.
  • SELL: Sell when a significant but not extremely long bear candle appears at the beginning of a red horizontal symbol line at the bottom of the indicator.

Input Settings:

  • Period: Period over which the bull/bear powers will be calculated (minimum is 5, default is 7).
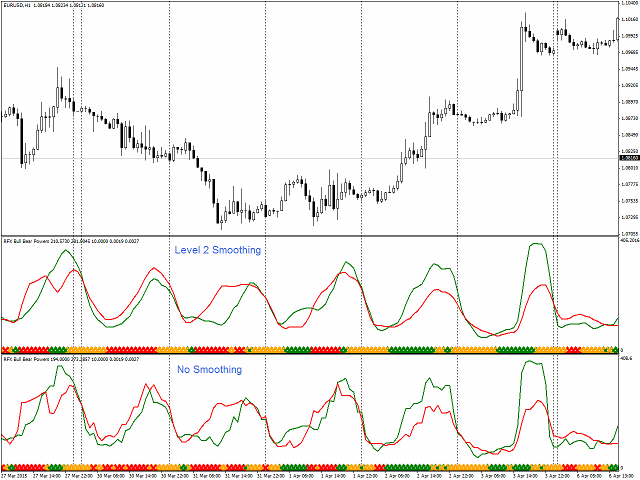
  • Smoothing Level: Smoothing level applies a moving average to the bull and the bear power.
    • No Smoothing:No smoothing will be applied (default).
    • Level 1 Smoothing:A moving average with period 2 will be applied.
    • Level 2 Smoothing:A moving average with period 3 will be applied.
  • Alert Notifications? if true, an alert notification will pop up for each BUY/SELL signal.
  • Email Notifications? if true, an email notification will be sent to your email address for each BUY/SELL signal.
  • Mobile Notifications? if true, a notification will be sent to your mobile phone (MT4 app) for each BUY/SELL signal.
  • Notification Start Hour (broker time): An integer number (0-23) which indicates the start hour for the BUY/SELL signals notifications (no notifications will be triggered before this hour).
  • Notification End Hour (broker time): An integer number (0-23) which indicates the end hour for the BUY/SELL signals notifications (no notifications will be triggered after this hour).

    Note: Do not take signal at the beginning or end of day. The best signals appear during the Frankfurt/London session.


    推荐产品
    This EA trails your stops based on percentage of current TP, for both manually and auto-opened trades.   You can edit the percentage value in the inputs. Trailing stop   is a more flexible variation of a normal exit order. T railing stop  is the practice of moving the stop-loss level closer to the current price when the price moves in your favor. Trailing the stop-loss allows traders to limit their losses and safeguard their positive trades. It is a very popular practice. This EA will manage you
    PnL Calendar MT4
    Keni Chetankumar Gajanan -
    Monitoring your trades over time helps you build up your account balance and shows when you miss your goals. Viewing the closed trades of a symbol on the chart can help you adjust your strategy for better results. Maintaining a trade book allows you to record the applied strategy and note the reason for taking each trade. It helps you to evaluate and refine strategies based on its profitability. A possibility to download the Account history as a text file with delimited fields, allows upload to
    This is the linear regression indicator for basic indicators included in the standard package of the MetaTrader 4 terminal. It is used for the analysis of price movements and market mood. The market mood is judged by the slope of the linear regression and price being below or above this line. Regression line breakthrough by the indicator line may serve as a market entry signal. There is possibility of setting the color for bullish and bearish sentiments of the basic indicators as well as plottin
    Footprint Chart
    Thomas Bradley Butler
    我添加了一个要求很高的足迹图请求。 该指标非常基本,显示买入量和卖出量。 它不是信号指标,它只会显示蜡烛的交易量并显示过去的值。 Forex 没有集中交易量,但这打破了并显示了逐笔交易量。 卖出蜡烛将显示询价,买入蜡烛将显示出价。 可以作为单一分析系统或与其他因素一起交易。 如果从这个意义上观察市场,这可能是有价值的信息。 我希望增加具有更多功能和特性的指标来帮助分析,价格将反映需求和更多特性。 我添加了一个要求很高的足迹图请求。 该指标非常基本,显示买入量和卖出量。 它不是信号指标,它只会显示蜡烛的交易量并显示过去的值。 Forex 没有集中交易量,但这打破了并显示了逐笔交易量。 卖出蜡烛将显示询价,买入蜡烛将显示出价。 可以作为单一分析系统或与其他因素一起交易。 如果从这个意义上观察市场,这可能是有价值的信息。 我希望增加具有更多功能和特性的指标来帮助分析,价格将反映需求和更多特性。
    Tick Bid Transaction
    Sebastian Germain
    Este indicador Tick Bid Transaction identifica las ventas que ofrece tu Broker. Relaciona el volumen “no real” y los Ticks de la demanda de un cierto modo, luego el algoritmo marca con un punto donde se realiza una transacción, según el tamaño del punto significa que la venta es mayor o menor o, hubo muchas ventas al mismo tiempo lo que nos dice que si el punto es muy grande es muy probable que el Activo baje como así también si hay una cierta acumulación de puntos de diferentes tamaños. Este in
    Zip Trend
    Vitalii Zakharuk
    Zip Trend This is a hybrid trend indicator as it is based on average true range signals that determine the range of low and high price fluctuations, as well as closing prices. As a result, it indicates the current market volatility. The indicator of the oscillator family is also used. The indicator helps to calculate the oversold and overbought levels of a trading instrument. This indicator allows you to find the most likely trend reversal points. When the trend changes, the Zip Trend indicat
    Smart Moving Averages Indicator Smart Moving Averages is an exclusive indicator for Metatrader platform. Instead of calculating moving averages for the selected chart time frame, the Smart Moving Averages indicator gives you the opportunity to calculate moving averages independently from the chart time frame. For instance you can display a 200 days moving average in a H1 chart. Inputs of the indicator are: Timeframe : timeframe to be used for the calculation of the moving average Perio
    Spread Histogram displays spread changes at each price movement. The product is very useful for scalpers as it allows them to spot good market entry points. Small spreads can be used to open a new order or close the current one. This indicator is equipped with: maximum spread minimum spread up / down spread histogram average spread Inputs: AveragePeriod (determine the average of the "X" Histogram) Shift Report
    Exponential moving average (EMA) and super trend are popular and good indicators that is often and used to determine the trend direction. One of the best trading strategies with trailing stop is trading strategy with using a combination of Exponential Moving Average (EMA) and Super Trend indicators. EMA SuperTrend Strategy Indicator is the indicator consist of  EMA, Super Trend and Alert function also other calculations are needed. It's also has extra indicator there are Automated Fibonacci Retr
    Mrscheck
    Benoit Ludovic Codogno
    MRS V2  contrôle le niveau des indicateurs: (Croisement des moyennes mobiles, RSI, Stochastique) Il passe un ordre d'achat ou de vente, si ces indicateurs sont orientés dans le sens que vous avez même défini . Il augmente sans problème les probabilités de réussite! -> pas d'algorithmie secrets ou incompréhensibles ... des indicateurs simples, fiables, qui passent le temps et les aléas des marchés. Basé sur une stratégie simple mais efficace  : Croisement des moyennes mobiles lente et rapide dét
    Meta Trends
    Samir Tabarcia
    Requirements Optimized to work with EURUSD. For timeframe 1H. Minimum recommended deposit is $600  for initial lot set to 0.10(do not set in less of 0.10 lot) ECN broker with low spread is recommended to get better results. (Money Management) Lot                                 0.10 EMA fast                         20 EMA slow                        50 Star_With_Candle_ID     15 ST                                  30 TP                                  60 (Mode Grid) Distance Grid Pips         
    Reverse Martingale, also known as the "Paroli" betting system, is a gambling strategy used primarily in games of chance such as roulette, blackjack, or even sports betting. Unlike the traditional Martingale system, where a player doubles their bet after a loss, the Reverse Martingale involves increasing the bet after a win and reducing it after a loss. This strategy is often employed by individuals hoping to take advantage of winning streaks and capitalize on short-term gains. Here's how the Rev
    Quick Panel Pro
    Ziheng Zhuang
    5 (1)
    这个EA是一个专业交易工具,让交易简易便捷, 整合了灵活的风险管理模块与六组交易面板。 MT5 版本: Quick Panel Pro Hedging 特性: 手数计算既简单又快,移动止损线StopLine时,手数就计算完了。 交易面板包含大多数交易操作(如多单全平,空单全平仓,平盈利单,平亏损单,等等),点击相应按钮就搞定。 六组面板之间切换也很方便,点击绿色按钮即可。 EA 可以在复查测试visual chart 图表上运行,这样复盘,交易训练等都很方便。 鼠标点击快速修改止损和止盈(不能用于复盘测试) 在一个黄色背景的面板上显示平均价格,以及画平均价格水平线。 点这里查看 面板解释: 面板包含两列,左列是与空单相关,右边则是与多单相关。 sell: 开一个空单 first: 平第一个空单,指的是开仓时间第一的那个空单 last:平最后的空单,指的是开仓时间最后的那个空单 all+: 平空单中的所有盈利的单子 all-: 平空单中的所有亏损的单子 max+: 平空单中盈利最大的那个单子 max-: 平空单中亏损最大的那个单子 min+: 平空单中盈利最小的那个单子 min-:
    Note: After installation, please go to Tools>Options>Expert Advisors and add   https://porsaj.com   to 'Allow WebRequest for listed URL'. Still Problem?! Please check Internet connection! Unveiling the Porsaj Scalper: Your Cutting-Edge MetaTrader 4 Utility for Precision Scalping Are you ready to take your forex trading to the next level? Look no further than the revolutionary Porsaj Scalper – a MetaTrader 4 utility designed to empower scalpers with the tools they need to thrive in the fast-pa
    The Last Fractals , is a trading system that uses fractals to determine market corrections. The Last Fractals, is a system that detects an entry point and initiates an operational algorithm. This algorithm is different if the input is correct or wrong. From the inputs you can control the initial loting of the algorithm, if the trade goes against you the lotage is maintained, but if it goes in your favor the lotage is increased to improve your profit. You can download the demo and test it
    One-Click Strategy One-Click Strategy is designed to make your life easier when placing trades. It is suited to be used with common strategies where you place your stop loss over the recent high or below the recent low. This is very common when you trade support and resistance for a bounce or break out.  Want to sell or buy? Press "sell" or "buy" and the SL is placed above/below the recent high/low with a target of your choice. Lot size is calculated based on your settings. Taking trades tak
    BFS Panel Control
    Vladimir Smorodintsev
    BFS Panel Control is an auxiliary panel for comfortable control and management of orders, combining orders of different instruments into related groups, with subsequent closing of groups according to specified conditions of profitability (or loss) and with a possible notification in Telegram. For example, you have a drawdown on several orders of the EURUSD, GBPUSD, USDJPY instruments, while you expect the BTCUSD instrument to grow strongly, you open a position with a large lot on the BTCUSD ins
    LINE TRADER是一種通用的半自動Expert Advisor,用於交易垂直和水平水平交易。 EA交易實際上包含4個用於繪製線條的按鈕。 EA交易自動在交易者選擇的任何行上工作。線可以以任何角度繪製。您只需要畫一條線: -OPEN-開單; -止損-止損; -接受-完全完成交易並確定所有利潤; -關閉-關閉訂單(越線時);          線條是標準繪製的,因此可以是射線或線段(可選)的形式。 此EA交易適合在以下交易中使用的交易者: -交易的水平水平和方法(突破,回調,錯誤突破); -模式(三角形,通道等); -垂直(傾斜,趨勢)水平; -交易趨勢,突破或趨勢反轉(所有類型的水平); -嵌套線; -使用水平或傾斜方法的任何其他類型的交易。 好處 EA簡單易懂; 適合新手交易者; EA交易適用於MetaTrader 4中可用的任何金融工具; 預選批次的類型/大小; LINE TRADER MT4顧問程序的功能 具有在任何工具和時間框架上使用的能力; 追踪未平倉頭寸的能力; 基本設置 -輸入線顏色是輸入線
    Inside Pro EA
    Yury Emeliyanov
    By default, the EA parameters allow you to trade the EUR/JPY M15 pair. In addition to the "Inside Bar" pattern, the Expert Advisor uses three indicators (Bulls Power, Previous High Low, Top Bottom Price) to open and close trades, but also uses Stop Loss and Take Profit. The lot size is indicated as a percentage of the account balance (by default 1% and the specified limit is 100 lots). Below are the test results for the last year. Other product:   https://www.mql5.com/ru/users/yura1994ru/seller#
    This indicator will show Buy (color Aqua) or Sell (color Magenta) arrow at the moment when a Long or a Short local trend (local to the current TimeFrame) is expected. The huge advantage is that the indicator does not have any input parameters. So, you will not waste your time and will not struggle to change them for different TimeFrames and currency pairs. This indicator is universal, but it will work better on H1 and lower TFs.
    Click and Go Trade Manager
    Victor Christiaanse
    5 (9)
    Click and Go Trade Manager, the ultimate solution for seamless trading execution. With a simple click on the chart, you can effortlessly define your stop loss, entry price, and target levels. No more hassle of inputting values manually - it's made incredibly intuitive and easy. Embedded risk management is a key feature of our Trade Manager. We understand the importance of protecting your investments, which is why the Click and Go Trade Manager incorporates risk management. When placing orders,
    Description Bulls CD LBT (Bulls Convergence/Divergence Low Bottom Top) is a universal analytical bulls convergence/divergence indicator between a financial instrument and any of the twenty two standard indicators included in МT4 package. The indicator is the first out of the two possible versions (LBT and LTB) of the bullish convergence/divergence origins. Due to its multiple use feature, the indicator allows you to find convergences/divergences between the price and various standard indicators
    This script is made for CSV Export of your trading history. 1. Filter your trade history for the desired time range 2. Drag and Drop the script on a chart. 3. Go to your files folder within the MQL4 folder. 4. Find the CSV. You can use CSV files for most database software, like Access, Sql or Excel. After importing data you can do analysis on it or starting tradingjournal or whatever you like :) Please keep in mind we deleted the decimal, cause depending on your area the decimal sign is a ".
    Price River
    Leonid Basis
    The indicator creates 2 dot lines representing an upper and lower bands and the main indicator aqua line as the price power. If the main line is swimming inside the bands, then you should wait and watch before entering the market. When the main line jumps out or in the bands, then you should make a long or a short position.
    RadarPriceActionSmallTF
    Roman Lipatov
    5 (2)
    This panel is designed for quick visual search for the price action patterns on several instruments simultaneously. It is possible to add and remove instruments. Clicking the signal button allows you to quickly move to the chart with the identified pattern and timeframe. The panel searches for 8 candlestick patterns: PIN-BAR, EXTERNAL BAR, INSIDE BAR, DOJI, LEVEL, HIGH/LOW OF N BAR, FAKEY, ONE-WAY N BAR. Any of the patterns or the periods can be disabled by clicking its title. It can also search
    This EA has been developed for EURUSD M30 timeframe. Everything is tested and ready for immediate use on real account. This Expert Advisor is based on   BREAKOUT of the PREVIOUS CANDLE CLOSE   after some time of consolidation .  It uses   STOP  pending orders with   FIXED STOP LOSS and TAKE PROFIT . Very SIMPLE STRATEGY with only FEW PARAMETERS. At 9:00 pm we are closing trading every Friday to prevent from weekly gaps. !!!Adjust these times to your broker time. Preset values are for UTC+2 only
    AW Ichimoku EA
    AW Trading Software Limited
    4.5 (2)
    AW Ichimoku EA 使用 Ichimoku Kinko Hyo 指标的信号进行交易。全自动化交易机器人配置灵活,工作场景多。产品中内置了许多有用的功能:自动手数计算、虚拟止盈以及关闭篮子中第一个和最后一个订单的能力 解决问题 ->   这里     / MT5版本->       这里     / 说明 ->       这里   优点: 简单、直观的设置 使用平均策略的机会 用最后一个订单覆盖第一个订单 自动计算手数 可自定义指标参数 三种通知类型:推送、电子邮件、警报 策略: 顾问可以根据“信号”部分中的指标设置执行各种策略: - Senkou Cloud 突破 - 考虑前一根蜡烛上的云 senkou 跨度;从顶部到底部突破云层是卖出信号。从底部到顶部突破云层是买入信号。也就是说,在前一根蜡烛上,价格低于云层,然后突破云层并高于云层,反之亦然。 - Senkou Cloud 反转 - 考虑云的方向,它根据上下边界、senkou 跨度 A 和 senkou 跨度 B 而变化,这些线在趋势变化时会转向并发出交易信号。反转时,指标中的云颜色会变成不同的颜色。在前一根蜡烛上
    QuantumPip MT4
    Evgeniy Scherbina
    The expert "QuantumPip" is a fully automated expert which can trade simultaneously 10 symbols: AUDCAD, AUDUSD, EURUSD, EURUSD, GBPCAD, GBPCHF, GBPUSD, NZDUSD, USDCAD, USDCHF, and USDJPY. The expert also uses prices of Gold to calculate inputs for the symbols. Currently I am doing tests to add 10 cross-currency symbols more. The expert uses 2 types of recurrent neural model - 1 network (decisions "buy" or "sell") and 2 networks (decisions "buy" or "uncertainty" and "sell" or "uncertainty"). Quant
    Historical and positioning trade volume calculator. Especially designed for trader who trade cryptos and familiar with the rules of Exchange. [IMPORTANT] Be sure load the historical orders in `Account History` tab for this tools to calculate properly.  - Just right click in `Account History` tab -> `Custom Period` -> Select the period you'd like it to calculate with. I've met some friends always want to know how their traded values and want to display them on chart. Here I represent to you
    Elevate your trading with the JagzFX Market Regime Filter—adapt, optimize, succeed in navigating through smooth or volatile price movements. Gain a deeper understanding of market dynamics to refine your strategy and make informed decisions. KEY FEATURES Price Action Analysis: Distinguishes between smooth and volatile price movements. Trend Identification: Pinpoints bullish or bearish trends with precision. Strength Assessment : Evaluates the strength of identified trends—whether strong or weak M
    该产品的买家也购买
    Gann Made Easy
    Oleg Rodin
    4.85 (82)
    Gann Made Easy 是一个专业且易于使用的外汇交易系统,它基于使用先生理论的最佳交易原则。 W.D.江恩。该指标提供准确的买入和卖出信号,包括止损和获利水平。您甚至可以使用推送通知在旅途中进行交易。 购买后请联系我!我将免费与您分享我的交易技巧和丰厚的红利指标! 您可能已经多次听说过江恩交易方法。通常 Gann 的理论不仅对于新手交易者而且对于那些已经有一定交易经验的人来说都是非常复杂的东西。这是因为江恩的交易方法在理论上并不那么容易应用。我花了几年时间来完善这些知识,并将最好的原则应用到我的外汇指标中。 该指标非常易于应用。您所需要的只是将其附加到您的图表并遵循简单的交易建议。该指标不断进行市场分析工作并寻找交易机会。当它检测到一个好的入口点时,它会为您提供一个箭头信号。该指标还显示止损和获利水平。 换句话说,当您像先生一样进行交易时,该指标会为您提供最佳江恩建议。江恩亲自告诉你此时此刻该做什么。但最好的部分是您不需要了解任何有关江恩交易原则的知识,因为该指标会为您完成整个市场分析工作。
    TPSpro RFI Levels
    Roman Podpora
    4.82 (22)
    指示       俄罗斯 -        英语   建议 与指示器一起使用     -       TPSpro 趋势专业版 -   MT4版本       交易中的一个关键要素是做出买卖交易工具决定的区域或水平。尽管主要参与者试图隐藏他们在市场中的存在,但他们不可避免地会留下痕迹。我们的任务是学习如何识别这些痕迹并正确解释它们。 主要功能: 向卖家和买家显示活跃区域! 该指标显示所有正确的初始买入和卖出脉冲水平/区域。激活这些水平/区域后,开始寻找切入点,水平会改变颜色并填充特定阴影。此外,还会显示箭头,以便更直观地了解情况。 显示更高时间范围内的级别/区域(MTF 模式) 添加了使用更高时间间隔显示级别/区域的功能。此外,该指标还具有自动趋势检测功能(   TPSproTREND PRO   )。 用于交易的单独专业的逐步算法。 该算法专为日内交易而设计,既可顺势交易,也可逆势交易。每个活动模板均提供详细说明。 适用于多种时间范围 。 TPSpro RFI 水平指标可用于图表上的任何时间范围,从一分钟(M1)开始一直到每月(MN)。 图形和声音警报。 该指标提供图形和声音指示
    Gold Stuff
    Vasiliy Strukov
    4.89 (239)
    Gold Stuff 是专为黄金设计的趋势指标,也可用于任何金融工具。 该指标不会重绘,也不会滞后。 推荐时间框架 H1。 在它指标工作全自动专家顾问 EA Gold Stuff。 你可以在我的个人资料中找到它。 重要! 购买后立即与我联系,以获得说明和奖金!   您可以免费收到我们的强力支持和趋势扫描指标的副本,请私信。大部头书! 购买后立即联系我以获得设置和个人奖励!   设置 绘制箭头 - 打开关闭。 在图表上绘制箭头。 警报 - 打开关闭声音警报。 电子邮件通知 - 打开关闭。 电子邮件通知。 Puch-notification - 打开关闭。 推送通知。 接下来,调整色域。 Gold Stuff 是专为黄金设计的趋势指标,也可用于任何金融工具。 该指标不会重绘,也不会滞后。 推荐时间框架 H1。 在它指标工作全自动专家顾问 EA Gold Stuff。 你可以在我的个人资料中找到它。 购买后立即联系我以获得设置和个人奖励!   设置 绘制箭头 - 打开关闭。 在图表上绘制箭头。 警报 - 打开关闭声音警报。 电子邮件通知 - 打开关闭。 电子邮件通
    Atomic Analyst
    Issam Kassas
    5 (2)
    首先值得强调的是,该交易指标是非重绘、非延迟的指标,这使其成为手动和机器人交易的理想选择。 用户手册:设置、输入和策略。 Atomic Analyst是一种PA价格行动指标,利用价格的力量和动量来寻找市场上更好的机会。配备了高级过滤器,可帮助去除噪音和假信号,并提高交易潜力。使用多层复杂的指标,Atomic Analyst扫描图表,并将复杂的数学计算转化为任何初学者都能理解并用来做出一致交易决策的简单信号和颜色。 “Atomic Analyst”是专为新手和经验丰富的交易者量身定制的综合交易解决方案。它将高级指标和一流功能融合为一体的交易策略,使其成为所有类型交易者的多功能选择。 日内交易和剥头皮策略:专为快速准确的日内交易和短期交易而设计。 日内和摆动交易策略:可用作追求价格大幅波动的日内和摆动交易者的可靠工具。 多货币和市场:凭借其可靠的精度,在不同的工具和市场上运作。 多个时间框架:可在多个时间框架上使用,性能良好。 稳定性:所有指标均不重绘、不重绘和不滞后,确保可靠的信号。 信号清晰度:提供箭头信号,用于清晰的入场和出场点。 实时警报:通过交易入场、SL和TP警报通知交
    Trend Punch
    Mohamed Hassan
    4.95 (19)
    This indicator is unstoppable when combined with our other indicator called  Support & Resistance . After purchase, send us a message and you will get it   for  FREE as a BONUS! Introducing Trend Punch , the revolutionary forex trend indicator that will transform the way you trade! Trend Punch is uniquely designed to provide precise buy and sell arrows during strong market trends, making your trading decisions clearer and more confident. Whether you're trading major currency pairs or exotic sym
    TPSproTREND PrO
    Roman Podpora
    4.79 (19)
    TPSpro TREND PRO 是一个趋势指标,可以自动分析市场并提供有关趋势及其每次变化的信息,并给出进入交易的信号而无需重新绘制! 该指标使用每根蜡烛,分别对其进行分析。指不同的脉冲——向上或向下脉冲。货币、加密货币、金属、股票、指数交易的准确切入点! MT5版本                 指标的完整描述   我们建议将其与 指示器 -   RFI LEVELS 一起使用 主要功能: 准确的输入信号,无需渲染! 如果出现信号,它仍然相关!这是与重提指标的一个重要区别,重提指标可以提供信号然后改变信号,这可能导致存款资金的损失。现在您可以以更高的概率和准确度进入市场。还有一个功能是在箭头出现后为蜡烛着色,直到达到目标(止盈)或出现反转信号。 显示止损/获利区域 为了提高搜索切入点时的视觉清晰度,创建了一个模块,该模块最初显示买入/卖出区域,在该区域中搜索进入市场的最佳点。用于处理止损水平的附加智能逻辑有助于随着时间的推移减小其大小,从而降低进入交易(移动 sl)时的初始风险。 显示较高时间范围内的最小值/最大值(MTF 模式) 添加了一项功能,可以显示较高时间间隔的最小
    Trend Screener
    STE S.S.COMPANY
    4.8 (87)
    趋势指标,趋势交易和过滤的突破性独特解决方案,所有重要趋势功能都内置在一个工具中! 它是 100% 非重绘多时间框架和多货币指标,可用于所有符号/工具:外汇、商品、加密货币、指数、股票。 限时优惠:支撑和阻力筛选指标仅售 50美元,终身有效。(原价 250 美元)(优惠延长) 趋势筛选器是有效的指标趋势跟踪指标,它在图表中提供带有点的箭头趋势信号。 趋势分析器指标中可用的功能: 1.趋势扫描仪。 2. 具有最大利润分析的趋势线。 3.趋势货币强度计。 4. 带有警报的趋势反转点。 5. 带有警报的强趋势点。 6. 趋势箭头 每日分析示例,每日信号表现...等与我们的趋势筛选指标,可以在这里找到: 点击这里 限时优惠:Trend Screener Indicator 仅售 50 美元且终身可用。原价 125$) 通过访问我们的 MQL5 博客,您可以找到我们所有的高级指标以及分析示例、每日信号表现...等。 : 点击这里 我们的趋势系统由 2 个指标组成: 1. Trend Screener Indicator:显示趋势仪表盘、图表中的趋势线、入场点...等。 2.
    FX Power MT4 NG
    Daniel Stein
    5 (12)
    通过 mql5 和 Telegram 上 的晨间简报获取每日市场更新,包括详细信息和屏幕截图 ! FX Power MT4 NG 是我们长期以来非常受欢迎的货币强度计算器 FX Power 的下一代产品。 这款下一代强度计算器能提供什么?您所喜爱的原版 FX Power 的所有功能 附加功能 黄金/XAU 强度分析 更精确的计算结果 可单独配置的分析周期 可自定义计算限制,以获得更好的性能 为希望查看更多信息的用户提供特殊的多实例设置 无尽的图形设置,可在每个图表中设置您最喜欢的颜色 无数的通知选项,让您再也不会错过任何重要信息 采用 Windows 11 和 macOS 风格的全新圆角设计 神奇的移动指标面板 FX Power 主要功能 所有主要货币的完整强势历史 所有时间框架内的货币强弱历史 所有经纪商和图表的计算结果完全相同 100% 可靠的实时计算 -> 无重绘 可通过下拉列表选择分析时段 通过自定义模式单独配置分析时段 可在一个图表中使用多个实例 可移动 FX Power 显示屏(通过拖放) 适用于高分辨率 QHD、UHD 和 4K 显示器 自动终端配置 针对平板电脑
    FX Volume
    Daniel Stein
    4.58 (33)
    通过 mql5 和 Telegram 上 的 " 晨间简报 "获取每日市场更新,包括详细信息和屏幕截图 ! 外汇交易量(FX Volume)是第一个也是唯一一个从经纪商角度真正洞察市场情绪的交易量指标。 直接在您的图表上看到这些信息是真正改变游戏规则和突破性的交易解决方案。 受益于独特的市场数据洞察,如 比率(Ratios )显示货币多头和空头头寸的比率(百分比 比率变化 显示所选时间段内的多头比率及其百分比变化 总交易量 显示货币的总交易量(多头和空头),以手为单位 多头 交易量显示货币所有多头头寸的交易量 空头 交易量显示所有货币空头头寸的交易量 净多头 显示净多头交易量,即所有多头头寸减去所有空头头寸(以手为单位)。 净多头百分比 显示货币净多头交易量的变化 请阅读我们的基本教程 -> "如何使用外汇交易量进行交易 " 获取更多信息,如常见问题、交易技巧和教程视频,请访问我们的 外汇交易量公共信息频道 请 安装并运行 SI Connect 以建立与我们数据中心的持续连接 背景信息 我们都知道,外汇是一个分散的市场。这就是为什么我们必须打破常规思维,开发一个独
    Scalper Inside PRO
    Alexey Minkov
    4.73 (56)
    An exclusive indicator that utilizes an innovative algorithm to swiftly and accurately determine the market trend. The indicator automatically calculates opening, closing, and profit levels, providing detailed trading statistics. With these features, you can choose the most appropriate trading instrument for the current market conditions. Additionally, you can easily integrate your own arrow indicators into Scalper Inside Pro to quickly evaluate their statistics and profitability. Scalper Inside
    - Real price is 80$ - 40% Discount ( It is 49$ now ) Contact me for instruction, add group and any questions! Related EA Product: Bitcoin Expert Introduction The breakout and retest strategy is traded support and resistance levels. it involves price breaking through a previous level.  The break and retest strategy is designed to help traders do two main things, the first is to avoid false breakouts. Many false breakouts start with a candlestick that breaks out of a level but ends with an immedi
    Enigmera
    Ivan Stefanov
    5 (3)
    ENIGMERA:市场核心 https://www.enigmera.com 简介 该指标和交易系统是金融市场的一种非凡方法。ENIGMERA 利用分形周期精确计算支撑位和阻力位。它能显示真实的累积阶段,并给出方向和目标。 该系统无论在趋势中还是在修正中都能发挥作用。 它是如何运行的? ENIGMERA 由三条线组成:支撑/阻力线、目标线和偏离线。与一般市场指标将过去的数据推断为现在和未来的情况不同,该系统能提供当前的完整情况。如果你处于支撑位,这意味着真正的支撑;如果你处于阻力位,这意味着真正的阻力。如果突破某一水平,则表示趋势发生变化。没有重绘。 由于市场在不断变化,ENIGMERA 不断调整其评估工具,定期修改策略。  这保证了每种情况都能得到全面评估。这一市场指标的独特性显而易见,其能力不言而喻。  ENIGMERA 为金融分析师和咨询师提供服务,他们需要可靠的见解与客户分享,也为投资者提供服务,他们需要最精确和最可靠的保证。 该系统能够达到最佳精度,使交易者能够自信、清晰地评估他们的选择。 ENIGMERA 将 20 年的交易专长和知识整合到一个综合软件
    Chart Patterns All in One
    Davit Beridze
    4.25 (8)
    Chart Patterns All-in-One 指标帮助交易者可视化技术分析中常用的各种图表形态。它帮助识别潜在的市场行为,但不保证盈利。建议在购买前在模拟模式下测试该指标。 当前优惠 : “Chart Patterns All in One” 指标享受 50% 折扣。 包含的形态 : 1-2-3 形态 :通过三个关键点(高点或低点)检测市场反转。 买入 :连续两个低点后出现较低的高点。 卖出 :连续两个高点后出现较高的低点。 可视化 :线条和箭头连接识别的点。 双顶和双底 :当价格形成两个连续的高点(双顶)或低点(双底)且它们大致相等时,表明反转趋势。 双顶 :看跌反转。 双底 :看涨反转。 可视化 :线条连接峰值或低谷,箭头标记反转点。 三顶和三底 :与双顶/双底类似,但有三个连续的高点或低点,信号更强的反转趋势。 三顶 :看跌反转。 三底 :看涨反转。 可视化 :线条和箭头标记形态。 三角形 :在趋势延续前识别整合期(基于 Zig-Zag,有时可能会延迟出现或消失)。 上升三角形 :看涨延续。 下降三角形 :看跌延续。 可视化 :在图表上绘制三角形,并用箭头标记突破点。 尽管
    MetaBands M4
    Vahidreza Heidar Gholami
    5 (2)
    MetaBands使用强大且独特的算法绘制通道并检测趋势,以便为交易者提供进出交易的潜在点。它是一个通道指标和强大的趋势指标。它包括不同类型的通道,可以通过使用输入参数简单地合并以创建新通道。MetaBands使用所有类型的警报通知用户市场事件。 功能 支持大多数通道算法 强大的趋势检测算法 能够合并不同类型的通道 多时间帧和多货币(信号矩阵) 所有类型的警报功能(声音、屏幕闪烁、推送通知、电子邮件、弹出窗口、箭头) 它永远不会重绘 趋势检测 MetaBands使用在通道内振荡的蓝色线来检测趋势。当该线遇到通道的上界时,表明开始下跌趋势,当它遇到下界时,表明开始上涨趋势。如果蓝线接近中线,则市场处于整理期。 该指标使用独特的方法来检测趋势。一开始可能看起来有些复杂,但如果您观看视频教程,您就会意识到它是多么强大且易于使用。 入场和出场信号 当趋势变化或价格穿过上下通道时,MetaBands会立即通过不同的方法提醒交易者,这些方法可以在指标设置中启用。 信号矩阵 要监视来自不同时间框架的多个符号并在一个地方查看信号,请单击右上角按钮或按键盘上的M键以打开信号矩阵。该矩阵可以
    Market Reversal Alerts
    LEE SAMSON
    4.19 (113)
    成為突破者,隨著價格反轉,市場結構會改變利潤。 訂單突破者指示器可以識別趨勢或價格走勢何時接近枯竭並準備好逆轉。它會提醒您市場結構的變化,通常會在發生逆轉或重大回調時發生。 該指標使用專有計算來確定突破和價格動能。每當在可能的耗盡點附近形成新的高點時,指標就會繪製最後一個生成該高點的順序塊。然後,它將隨價格移動隨價格跟隨定單。然後,當價格轉向相反方向並突破該訂單塊時,它會提醒您,從而創建新的市場結構並開始趨勢或重大回調的可能逆轉。 訂單塊是在創建高/低之前的最後一個相反的彩色蠟燭,並且當價格跌破這些關鍵區域以下時,這表明趨勢可能會發生短期或長期反轉。 特徵 提醒您關鍵耗盡點的市場結構變化 價格接近耗盡水平時自動提取訂單塊 在一個方向繼續移動時,在價格後面跟踪定單,以提醒您最佳的反轉輸入 將顏色更改為純色塊,以顯示何時發生市場結構中斷。 適用於所有交易品種和時間範圍 內置集成的彈出窗口和電子郵件警報 策略和如何與定單破壞者指標進行交易 當斷路器塊發生時,您有兩個選擇。 看左邊!我們正在尋求供應/需求或支撐/阻力位嗎?市場結構轉變(逆轉)通常發生在價格重新測試舊水平或
    目前八折优惠! 对任何新手或专家交易者来说都是最好的解决方案! 这个仪表板软件适用于28种货币对。它基于我们的两个主要指标(高级货币强度28和高级货币冲动)。它对整个外汇市场提供了一个伟大的概述。它显示高级货币强度值,货币运动速度和28个外汇对在所有(9)时间段的信号。想象一下,当你可以使用图表上的单一指标观察整个市场,以确定趋势和或剥头皮的机会时,你的交易将得到改善 我们已经在这个指标中建立了一些功能,使你更容易识别强势和弱势货币,同时识别和确认潜在的交易。该指标以图形方式显示货币的强势或弱势是增加还是减少,以及它在所有时间段的表现。 增加的新功能是动态市场斐波那契水平,它适应当前的市场条件变化,这是一个已经在我们的高级货币强度28和高级货币冲动指标中使用的成熟的加分项。 在交易时,总是将弱势货币和强势货币配对,这个新指标将帮助你做到这一点。 用户手册:点击这里  https://www.mql5.com/en/blogs/post/708783 特点  显示每个时间段的ACS28和GAP-speed(冲动)的货币强度值。 列:颜色代码以7种颜色
    Bomb Bank Signal
    Igor Pereira Calil
    5 (1)
    炸彈銀行訊號:您對 MetaTrader 4 的信心指標 Bomb Bank Signal 是 MetaTrader 4 的一個強大指標,旨在識別金融市場中最相關的趨勢。如果您正在尋找一種能夠準確預測運動的工具,那麼炸彈庫就是您需要的盟友。 運作原理: 該指標結合了三種不同的方法——成交量分析、蠟燭收盤價和對稱趨勢——來偵測和發出買賣機會訊號。當炸彈銀行識別出買入機會時,它就像一顆「炸彈」;當它偵測到賣出訊號時,它就像一個「頭骨」。 為什麼炸彈銀行不一樣? 完全可靠性:炸彈庫訊號不會刪除訊號。訊號一旦發出,就會一直存在,確保您不會錯過任何機會。 極為準確:炸彈庫不會發出錯誤訊號。它會即時更新您的訊息,隨著市場的變化進行調整,但保持先前訊號的透明度。 即時更新:訊號被即時識別並在必要時更新,使您能夠快速響應市場變化。 最大化您的結果: 炸彈銀行訊號是識別趨勢持續走勢的理想選擇。例如,如果您已經做空並且指標在 M15 發出買入訊號,那麼現在就是平倉或部分下單的最佳時機,反之亦然。 此外,經過仔細分析,我們建議您遵循M30、H1和H4上的訊號,停損僅50點。這使
    Trend Cutter
    Oleg Rodin
    5 (2)
    Trend Cutter 是一种趋势指标,可用于任何时间范围,包括 M1 和 M5 等较低时间范围。该指标对于喜欢日内交易的交易者来说是理想的选择,并且对那些喜欢长期交易的交易者也有帮助。您可以使用该指标作为您的交易系统的基础或作为独立的交易解决方案。 该指标提供所有类型的警报,包括推送通知。 指标中有一个易于使用的输入参数,可让您按照您希望的方式调整信号。此选项将为您提供交易的灵活性。 您也可以在任何您想要的市场进行交易。 该指标非常容易使用。您只需遵循信号即可。我还将免费向该指标的所有用户提供附加指标,这将帮助您尽可能高效地使用该方法。 购买后请联系我以获得我的交易提示和丰厚奖金! 感谢您的关注! 祝您交易顺利、盈利!
    Currency Strength Wizard
    Oleg Rodin
    4.93 (44)
    货币强度向导是一个非常强大的指标,为您提供成功交易的一体化解决方案。该指标使用多个时间范围内所有货币的数据来计算这个或那个外汇对的力量。此数据以易于使用的货币指数和货币电力线的形式表示,您可以使用它们来查看这种或那种货币的力量。 您所需要的只是将指标附加到您要交易的图表上,该指标将向您显示您交易的货币的真实强度。该指标还向您显示买卖量压力的极值,您可以在顺势交易时利用这些压力。该指标还显示了基于斐波那契的可能目标。该指标可用于各种交易时间范围。该指标支持各种货币对的交易。 该指标为您提供所有类型的警报,包括推送通知。 购买后请联系我。我将与您分享我的交易技巧,并免费为您提供丰厚的红利指标! 祝您交易愉快,获利丰厚!
    TakePropips Donchian Trend Pro
    Eric John Pajarillaga Aldana
    4.44 (16)
    TakePropips Donchian Trend Pro   (MT4) 是一款功能强大且有效的工具,可使用 Donchian 通道自动检测趋势方向,并为您提供进场和退场交易信号! 这个多功能指标包括趋势扫描器、交易信号、统计面板、筛选器、交易时段和警报历史仪表板。它旨在为您提供交易信号并节省您分析图表的时间! 您可以在我们的博文中下载用户手册和安装指南:   https   :// www.mql5.com/en/blogs/post/751368 今天立减 50%!价格从 98 美元降到 49 美元! 您可以在 Strategy Tester 上测试该指标(启用可视模式) 视频教程也可在说明下方获得更多详细信息。 如果您有任何问题或需要任何帮助,请与我联系。 TakePropips Donchian Trend Pro 指标适用于所有外汇对、金属、商品、指数和加密货币。 主要特点 交易信号 - 检测多个时间范围内所有货币对的买卖机会。它将为您提供警报并在图表上绘制交易信号,最多 3 个止盈价和一个止损价。 Trend Scanner   - 用于快速扫描和识别跨多个时间
    Supply and Demand Dashboard PRO
    Bernhard Schweigert
    4.8 (20)
    目前八折优惠! 这个仪表板是一个非常强大的软件,可用于多个符号和多达9个时间段。 它是基于我们的主要指标(最佳评论:高级供应需求)。 Advanced Supply Demand 该仪表板提供了一个伟大的概述。它显示。   筛选后的供需值,包括区域强度评级。 区间内和区间外的点位距离。 它突出了嵌套的区域。 在所有(9个)时间段内,它对所选符号发出4种警报。 它是高度可配置的,以满足您的个人需求! 您的利益! 对每个交易者来说,最重要的问题是。 什么是入市的最佳水平? 在强大的供应/需求区域内或附近进入你的交易,以获得最佳的成功机会和风险/回报。 我的止损的最佳位置是哪里? 把你的止损放在强势供应/需求区的下方/上方是最安全的。 我的最佳盈利目标是什么? 你的退出策略和你的进入策略一样重要,了解更高的时间框架图可以帮助你。对于买入,使用下一个供应区作为目标,对于卖出,使用下一个需求区作为目标。在回撤到供应区或需求区时进场,以确保有足够的利润空间,达到更高的时间框架的供应和需求,将增加你的利润。 为什么我们要过滤强区和
    Advanced Currency Strength28 Indicator
    Bernhard Schweigert
    4.9 (649)
    目前26%的折扣 任何新手或专家交易者的最佳解决方案! 这个指标是一个独特的、高质量的、可负担得起的交易工具,因为我们纳入了一些专有的功能和一个新的公式。只需一个图表,你就可以读出28个外汇对的货币强度!想象一下,你的交易将如何得到改善,因为你的交易是在你的手中进行的。想象一下,你的交易将如何改善,因为你能够准确地确定新趋势或剥头皮机会的触发点? 用户手册:点击这里  https://www.mql5.com/en/blogs/post/697384 这是第一本,原版的! 不要买一个毫无价值的崇拜者的克隆品。 特别的 子窗口中的箭头显示强劲的货币势头GAP将指导你的交易! 当基础货币或报价货币处于超卖/超买区域(外盘斐波那契水平)时,在个人图表的主窗口中出现警告信号。 当货币力量从外围区间回落时,回撤/反转警报。 十字星模式的特别警报 可选择多个时间框架,以快速查看趋势! 货币强度线在所有的时间框架中都非常平稳,当使用较高的时间框架来识别总体趋势,然后使用较短的时间框架来确定精确的入口时,效果非常好。你可以根据自己的意愿选择任何时间框架。每个时间框架都由其自身进
    Advanced Currency IMPULSE with ALERT
    Bernhard Schweigert
    4.9 (480)
    目前31%的折扣!! 对任何新手或专家交易者来说都是最好的解决方案! 这个指标是一个独特的、高质量的、负担得起的交易工具,因为我们已经纳入了一些专有的功能和一个秘密的公式。只需一张图表,它就能给出所有28种货币对的警报。想象一下,你的交易将如何改善,因为你能够准确地确定新趋势或剥头皮机会的触发点 建立在新的基础算法上,它使识别和确认潜在交易变得更加容易。这是因为它以图形方式显示了一种货币的强势或弱势是否正在加速,并测量了这种加速的速度--把它想象成你汽车中的速度表。当你加速时,事情显然会发生得更快,这在外汇市场上也是一样的,即如果你配对的货币正在向相反的方向加速,你就会发现一个潜在的有利可图的交易。 货币动量的垂直线和箭头将指导你的交易! 动态的市场斐波那契23水平被用作警报触发器,将适应市场活动。如果冲动触及黄色触发线,您将在MetaTrader或您的电子邮件或推送警报中收到警报。然后你就知道作为一个交易员应该做什么。货币对和方向已经给出。只要点击警报按钮,就可以切换到该货币对或打开一个新的图表,以便进一步分析。警报级别可以通过用户输入来改变,可以选择3个敏感度级别
    IX Power MT4
    Daniel Stein
    5 (5)
    IX Power 终于将 FX Power 的无与伦比的精确性带到了非外汇交易符号中。 它能准确判断您喜爱的指数、股票、商品、ETF 甚至加密货币的短期、中期和长期趋势强度。 您可以 分析 终端提供的 一切 。试试吧,体验一下您在交易时如何把握 时机 。 IX Power 主要功能 100% 精确的非重绘计算结果 - 适用于您终端中的所有交易符号 下拉式选择预配置以及可单独配置的强度分析周期 通过电子邮件、消息和手机通知的无数种通知选项 可访问的 EA 请求缓冲区 可自定义计算限制,以获得更好的性能 为希望查看更多信息的用户提供特殊的多实例设置 无尽的图形设置,让您在每个图表中都能找到最喜欢的颜色 采用 Windows 11 和 macOS 风格的圆角新面板设计 神奇的移动指标面板,可在子窗口和主图表之间无缝移动 适用于高分辨率 QHD、UHD 和 4K 显示器,并针对平板电脑和触摸屏进行了优化 IX Power 参数 最重要的参数不言自明,但我们很快会在另一篇文章中为您提供所有 IX Power 参数的完整说明。 使用别名 "参数可为技术交易
    Stratos Pali
    Michela Russo
    Stratos Pali Indicator   is a revolutionary tool designed to enhance your trading strategy by accurately identifying market trends. This sophisticated indicator uses a unique algorithm to generate a complete histogram, which records when the trend is Long or Short. When a trend reversal occurs, an arrow appears, indicating the new direction of the trend. Important Information Revealed Leave a review and contact me via mql5 message to receive My Top 5 set files for Stratos Pali at no cost! D
    自动在你的图表上画出支撑位和阻力位以及推动性蜡烛缺口,这样你就可以看到价格接下来可能会走向哪里和/或可能会逆转。 该指标旨在作为我的网站(The Market Structure Trader)上教授的头寸交易方法的一部分,并显示目标和潜在入场的关键信息。 该指标有两个核心功能和四个附加功能: 核心功能1 - 日线、周线和月线的自动支持和阻力线 该指标为你自动绘制过去2天以及6周和数月前的最新支撑和阻力水平。你可以完全自定义这些水平的外观以适合你,并显示多少个。这些关键水平通常作为主要的支持和阻力区,价格将从这里转向并回撤或逆转。它们也是价格将走向的目标,因此你可以迅速看到在价格可能转向之前交易的潜在距离。 核心特征2--推进型蜡烛缺口目标 推进性缺口蜡烛是银行和机构通过在任何市场上执行大额头寸而创造的强劲、快速的移动。这些大阳线一旦形成,有两个关键作用。 1. 1.它们作为一个方向性信号,因为大型市场参与者已经选择了一个方向,一旦发生,价格往往会在一段时间内继续移动。 2. 2.更重要的是,它们作为目标,因为这些区域往往会让其他大玩家的头寸 "越位",价格在绝大
    此儀表板是與市場結構反轉指標一起使用的警報工具。它的主要目的是提醒您在特定時間範圍內的逆轉機會,以及像指標一樣重新測試警報(確認)。儀表板設計為單獨放置在圖表上,並在後台工作,以向您發送有關您選擇的貨幣對和時間範圍的警報。它是在許多人要求衝刺以同時監控多個貨幣對和時間框架而不是讓市場反轉指標在一個 MT4 中的多個圖表上運行之後開發的。它會在 M5、M15、M30、H1、H4 和 D1 時間範圍內發出警報。當然,與交易中的任何事情一樣,更高的時間框架效果最好。 該儀表板被設計為市場結構反轉指標的附加組件。它將獨立工作,並提醒市場反轉警報指標給出的模式和信號。 在此處獲取市場反轉警報指標: https://www.mql5.com/en/market/product/46295 此儀表板的 MT5 版本可在此處獲得: https://www.mql5.com/en/market/product/65828 此處提供 EA:汽車交易市場反轉警報! https://www.mql5.com/en/market/product/65383 我創建的用於繪製矩形並提醒特定貨幣對的市
    Gold Channel XAUUSD
    Paulo Rocha
    5 (2)
    Gold Channel is a volatility-based indicator, developed with a specific timing algorithm for the XAUUSD pair, which consists of finding possible corrections in the market. This indicator shows two outer lines, an inner line (retracement line) and an arrow sign, where the theory of the channel is to help identify overbought and oversold conditions in the market. The market price will generally fall between the boundaries of the channel. If prices touch or move outside the channel it is a tra
    PRO Renko System
    Oleg Rodin
    5 (25)
    PRO Renko Arrow Based System for trading renko charts.  准确的信号交易任何外汇工具. 另外,我将免费提供系统的附加模块! PRO Renko系统是RENKO图表上高度准确的交易系统。该系统是通用的。 该交易系统可应用于各种交易工具。 该系统有效地中和了所谓的市场噪音,打开了获得准确反转信号的通道。 该指标易于使用,只有一个参数负责产生信号。 您可以很容易地使算法适应您感兴趣的交易工具和renko酒吧的大小。 我很乐意通过提供任何咨询支持来帮助所有客户有效地使用该指标。 祝您交易成功!购买后,立即写信给我! 我将与您分享我的建议和我的renko发电机。 另外,我将免费提供系统的附加模块!
    首先,值得强调的是,这个交易工具是非重绘、非重画和非滞后的指标,非常适合专业交易。 在线课程,用户手册和演示。 智能价格行动概念指标是一个非常强大的工具,既适用于新手,也适用于经验丰富的交易者。它将超过20个有用的指标合并到一个指标中,结合了高级交易思想,如内圈交易员分析和智能资金概念交易策略。该指标侧重于智能资金概念,提供有关大型机构交易方式的见解,帮助预测它们的动向。 它在流动性分析方面尤其擅长,有助于理解机构的交易方式。它擅长预测市场趋势,并仔细分析价格波动。通过将您的交易与机构策略对齐,您可以更准确地预测市场走向。该指标多才多艺,擅长分析市场结构,识别重要的订单区块,并识别各种模式。 它擅长识别BOS和CHoCH等模式,理解动量的转变,并突出显示供需强劲的关键区域。它还擅长发现强大的不平衡,并分析价格创造更高高点或更低低点的模式。如果您使用斐波那契回撤工具,该指标可以满足您的需求。它还可以识别相等的高点和低点,分析不同的时间框架,并通过仪表板显示数据。 对于使用更高级策略的交易者,该指标提供了工具,如公平价值差指标和优惠和折扣区域的识别。它特别关注高时间框架订单
    作者的更多信息
    RFX Delta Volume
    Rasoul Mojtahedzadeh
    5 (1)
    Note: This indicator cannot be tested in the strategy tester. Please download the free demo version from   https://www.mql5.com/en/market/product/48627 RFX Delta Volume is an indicator to show bullish and bearish volumes separately for each trading candle. The indicator uses history data of one minute (M1) to estimate the true bullish and bearish volumes in a sub-window. There are two modes of operations for this indicator. In mode "Delta Volume", the indicator shows the difference in bullish a
    Adaptive RSI
    Rasoul Mojtahedzadeh
    5 (2)
    Relative Strength Index (RSI) is one of the most popular and accurate oscillators widely used by traders to capture overbought and oversold areas of price action. Although the RSI indicator works fine for a period of market, it fails to generate profitable signals when market condition changes, and hence produces wrong signals which results in big losses. Have you ever thought about an adaptive RSI indicator that adapts its period of calculation based on the market conditions? The presented indi
    Trendometer
    Rasoul Mojtahedzadeh
    5 (2)
    Identifying the trend of the market is an essential task of traders. Trendometer implements an advanced algorithm to visualize the trend of the market. The major focus of this indicator is to evaluate the market in the lower time frames (i.e., M1, M5 and M15) for the scalping purposes. If you are a scalper looking for a reliable indicator to improve your trade quality, Trendometer is for you. The indicator runs on a separate window showing a histogram of red and green bars. A two consecutive gre
    Adaptive Stochastic
    Rasoul Mojtahedzadeh
    5 (2)
    Stochastic Oscillator is one of the most popular and accurate oscillators widely used by traders to capture overbought and oversold areas of price action. Although the Stochastic indicator works fine for an interval of the market, it fails to generate profitable signals when the market conditions change, and hence it produces wrong signals resulting in big losses. Have you ever thought about an adaptive Stochastic indicator that adapts its period of calculation based on the market conditions? Th
    RFX EasyTrade
    Rasoul Mojtahedzadeh
    5 (1)
    RFX EasyTrade  is a professional panel to make your trades as easy as possible. You can perform scalping by acting fast and efficient. You can draw a box or a trend line and let RFX EasyTrade to catch a breakout and manage the trade automatically. You can set pending orders and set Order-Cancels-Order easily. If you are a fan of Martingale strategy just set a few settings on the panel and let RFX EasyTrade to automatically manage the trades. You can trade based on time without waiting long time
    RFX Forex Strength Meter
    Rasoul Mojtahedzadeh
    5 (1)
    RFX Forex Strength Meter is a powerful tool to trade 8 major currencies in the Forex market, U.S. Dollar ( USD ) European Euro ( EUR ) British Pound ( GBP ) Swiss Franc ( CHF ) Japanese Yen ( JPY ) Australian Dollar ( AUD ) Canadian Dollar ( CAD ) New Zealand Dollar ( NZD ) The indicator calculates the strength of each major currency using a unique and accurate formula starting at the beginning of each trading day of your broker. Any trading strategy in the Forex market can be greatly improved
    RFX Market Speed
    Rasoul Mojtahedzadeh
    RFX Market Speed is an indicator designed to measure a new dimension of the market which has been hidden from the most traders. The indicator measures the speed of the market in terms of points per second and shows the measurements graphically on the chart, and saves the maximum bullish and bearish speeds per each bar. This indicator is specially designed to help the scalpers of any market with their decisions about the short bias of the market. Note: The indicator uses real-ticks and CANNOT be
    RFX Forecast Bands
    Rasoul Mojtahedzadeh
    The RFX Forecast Bands indicator calculates the three significant confidence levels, 99%, 95% and 68% of price movement for a configurable number of bars in the future. The essence of calculations is based on statistical analysis of the asset's recent price changes. These levels can be used for many different purposes in trading systems. For example, one can use them for setting the target profit and stop loss levels effectively. The extreme upper and lower bands represent 99% confidence level,
    RFX Market Speed MT5
    Rasoul Mojtahedzadeh
    RFX Market Speed is an indicator designed to measure a new dimension of the market which has been hidden from the most traders. The indicator measures the speed of the market in terms of points per seconds and shows the measurement graphically on the chart, and saves the maximum bullish and bearish speeds per each bar. This indicator is specially designed to help the scalpers of any market with their decisions about the short bias of the market. The indicator uses real-ticks and cannot be fully
    RFX5 Forex Strength Meter
    Rasoul Mojtahedzadeh
    5 (1)
    RFX Forex Strength Meter is a powerful tool to trade 8 major currencies in the Forex market, U.S. Dollar ( USD ) European Euro ( EUR ) British Pound ( GBP ) Swiss Franc ( CHF ) Japanese Yen ( JPY ) Australian Dollar ( AUD ) Canadian Dollar ( CAD ) New Zealand Dollar ( NZD ) The indicator calculates the strength of each major currency using a unique and accurate formula starting at the beginning of each trading day of your broker. Any trading strategy in the Forex market can be greatly improved
    RFX5 Trendometer
    Rasoul Mojtahedzadeh
    Identifying the trend of the market is an essential task of traders. Trendometer implements an advanced algorithm to visualize the trend of the market. The major focus of this indicator is to evaluate the market in the lower time frames (i.e., M1, M5 and M15) for the scalping purposes. If you are a scalper looking for a reliable indicator to improve your trade quality, Trendometer is for you. The indicator runs on a separate window showing a histogram of red and green bars. A two consecutive gre
    Pairs Trading Expert
    Rasoul Mojtahedzadeh
    This expert advisor implements the conventional quantitative trading algorithm known as Pairs Trading. It operates by identifying a hedge ratio between two correlated trading symbols, thereby generating a synthetic stationary symbol suitable for trading through a mean-reversion strategy. The expert advisor dynamically computes the optimal hedge ratio for the selected symbols and initiates synthetic BUY/SELL positions when the spread of the synthetic price deviates from the mean level, reaching e
    RFX5 Bull Bear Powers
    Rasoul Mojtahedzadeh
    RFX5 Bull Bear Powers   indicator shows the absolute power of bulls and bears controlling the market. Both powers are shown simultaneously with red and green colors for bear and bull powers respectively. When red line goes over the green line it means that bears are controlling the market. When green line goes over the red line it means that bulls are controlling the market. The green/red horizontal symbol line at the bottom of the indicators shows which party has more strength. Time Frame:   M3
    筛选:
    无评论
    回复评论
    版本 1.12 2020.04.03
    - Improved calculation formula.
    - Add Buy/Sell signal lines.
    版本 1.11 2020.03.23
    - Improves performance
    版本 1.10 2015.05.12
    - Notifications added
    1) Alerts
    2) Emails
    3) Mobile Phone