Diamond by MMD MT5
- 指标
- Mariusz Maciej Drozdowski
- 版本: 7.33
- 更新: 26 四月 2023
- 激活: 5
MMD 的鑽石
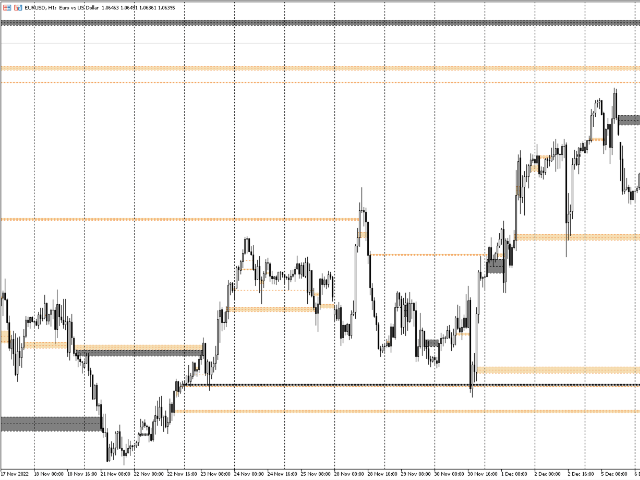
MMD 的鑽石是一種高級指標,可識別對價格行為重要的位置。
該指標 - 在任何時間範圍內 - 檢測並標記圖表上的價格反應區域。
鑽石 - MMD 方法中知識金字塔的元素之一 - 是滿足非常嚴格條件的蠟燭。
鑽石主要有兩種類型:
- 標準鑽石
- 逆轉癡呆症。
這兩種型號都會自動識別並標記在圖表上。
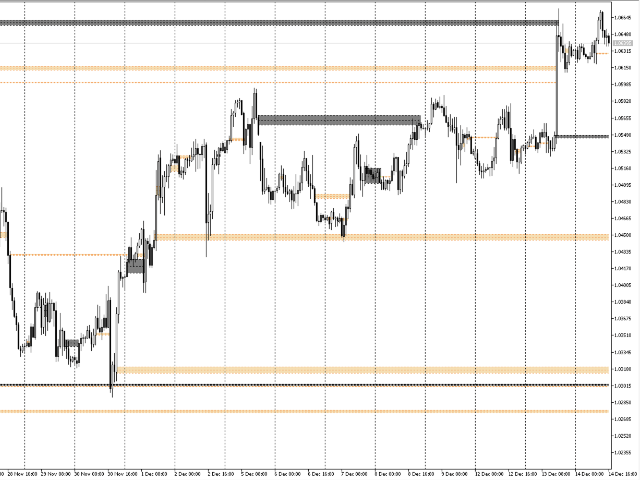
該指標可以標記鑽石,例如從 M5 區間到 H1 區間。 該指標的默認設置在您當前打開圖表的時間範圍內顯示菱形。
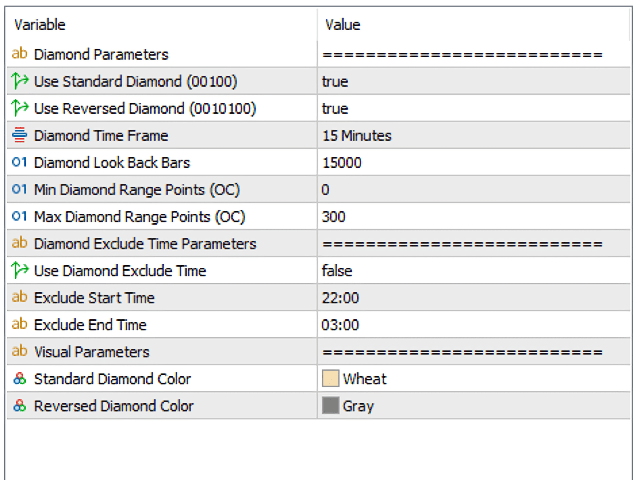
指標參數說明。
使用標準鑽石 - 顯示/隱藏模型 00100 中的鑽石
使用反轉鑽石 - 顯示/隱藏模型 0010100 中的鑽石
Diamond Time Frame - 一個選項,允許您指示顯示鑽石的時間間隔。 例如,可以使用 M1 或 H1 蠟燭圖在圖表上顯示 M5 區間的鑽石。
Diamond Look Back Bars - 指定蠟燭的數量 - 在給定的時間間隔內 - 將掃描 - 以搜索滿足為鑽石選擇的參數的蠟燭。
Min Diamond Range Points - 最小鑽石大小(以點為單位)。
Max Diamond Range Points - 最大鑽石大小(以點為單位)。
使用鑽石排除時間 - 參數的激活/停用。 此參數負責確定滿足為鑽石設置的條件的蠟燭將不會在圖表上標記的時間。 這尤其適用於夜間。
排除開始時間 - 指示不標記鑽石的時間段的開始時間。
Exclude End Time - 指示鑽石將不被標記的時間段的結束時間。
標準鑽石顏色 - 標準鑽石的顏色。
反轉鑽石顏色 - 反轉鑽石的顏色。