• 概述
  • 评论
  • 评论
  • 新特性

IFrankenstein

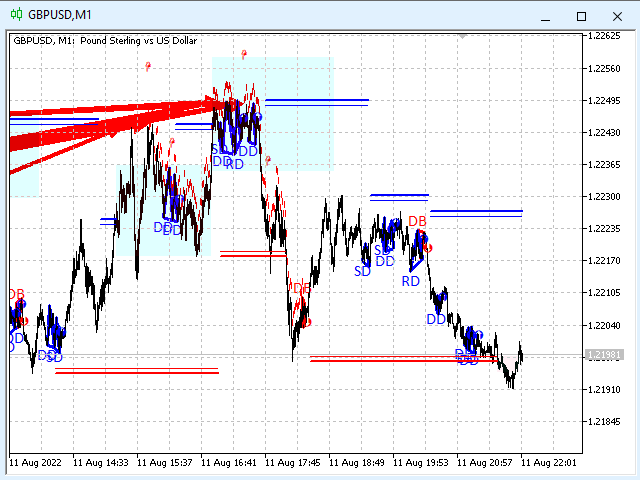
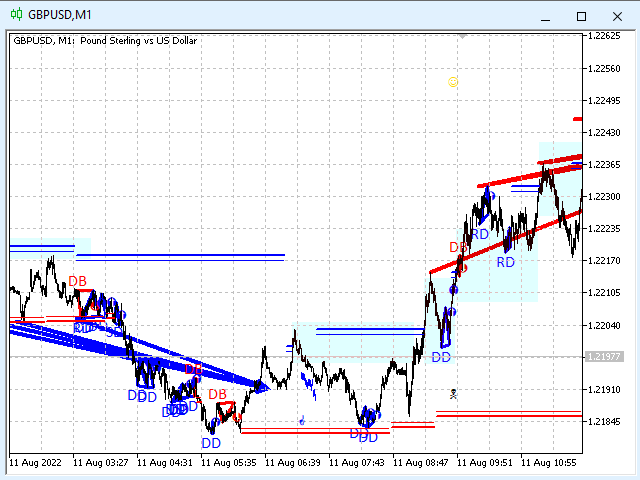
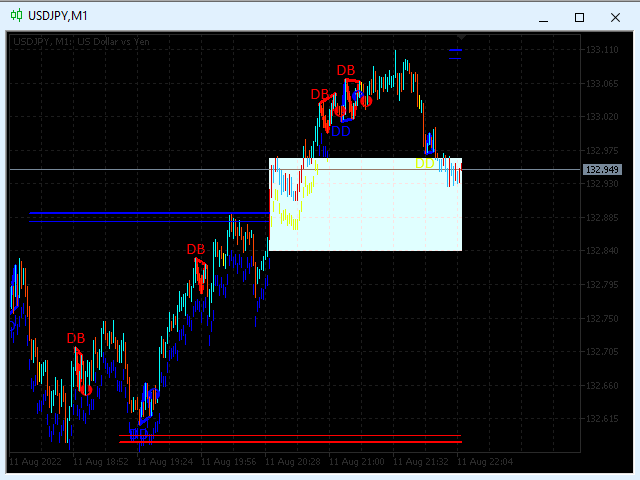
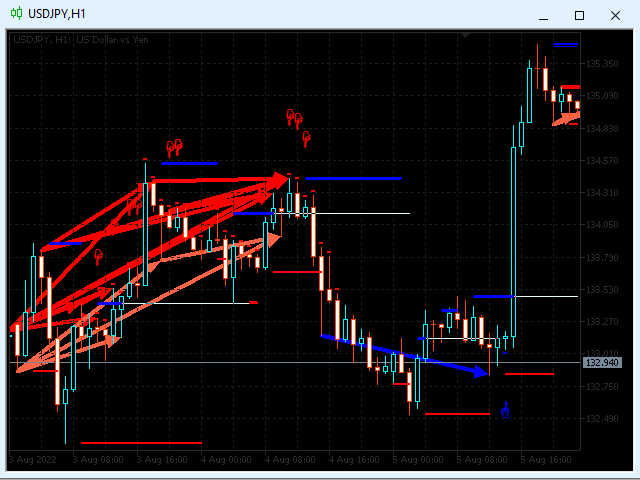
iFrankenstein - an essential part of TS_DayTrader trading system(Frank.ex5/Franken.ex5/Frankenstein.ex5).

The indicator provides with 10 pattern-based signals.
For each of the 10 patterns there's a number of internal indicators and filters used:

Fractals
KeyLevels
RSI Divergences
BollingerBands
ATR
Technical Pocket
Pattern-specific volatility filters

The first 30 buffers of the indicator export a signal
that consists of TakeProfit, StopLoss, Price values, for each of the 10 patterns.

Parameter "Retrospection depth" limits the number of bars processed for saving CPU resources.

For more information see Frank.ex5 and Frankenstein.ex5 - our main products.
Also read our blog - you can find there info on oncoming updates and fresh .set files for the TS_DayTrader trading environment.

iFrankenstein 4.53, released on Aug 16 2022.

推荐产品
Introduction to X3 Chart Pattern Scanner X3 Cherart Pattern Scanner is the non-repainting and non-lagging indicator detecting X3 chart patterns including Harmonic pattern, Elliott Wave pattern, X3 patterns, and Japanese Candlestick patterns. Historical patterns match with signal patterns. Hence, you can readily develop the solid trading strategy in your chart. More importantly, this superb pattern scanner can detect the optimal pattern of its kind. In addition, you can switch on and off individu
Owl Smart Levels MT5
Sergey Ermolov
4.47 (36)
MT4版本  |   FAQ Owl Smart Levels Indicator 是一個完整的交易系統,包含 Bill Williams 的高級分形、構建正確的市場波浪結構的 Valable ZigZag 以及標記準確入場水平的斐波那契水平等流行的市場分析工具 進入市場和地方獲利。 策略的详细说明 指示灯使用说明 顾问-贸易猫头鹰助手助理 私人用户聊天 ->购买后写信给我,我会将您添加到私人聊天中,您可以在那里下载所有奖金 力量在於簡單! Owl Smart Levels 交易系統非常易於使用,因此適合專業人士和剛開始研究市場並為自己選擇交易策略的人。 策略和指標中沒有隱藏的秘密公式和計算方法,所有策略指標都是公開的。 Owl Smart Levels 允許您快速查看進入交易的信號,突出顯示下訂單的水平並向您發送有關已出現信號的通知。 優點很明顯: 清楚地顯示主要和更高時間框架的趨勢方向。 指示儀器信號的出現。 標記開單、止損設置和固定利潤的水平。 沒有多餘的,只有必要的結構! ZigZag 表示全球趨勢的方向,因此也表示貿易方向。 市場反轉點的短線清楚地表明在什麼水平上構建斐波
Candle hunter
Ruslan Khasanov
5 (1)
圖形分析指標。 在圖表上標記主要的日本燭台形態。 目前,交易者可以使用以下一組模式:  - Bearish/Bullish Abandoned Baby;  - Bearish Advance Block;  - Bearish Deliberation;  - Bearish/Bullish Belt Hold;  - Bearish/Bullish Engulfing;  - Bearish Shooting Star;  - Bearish Evening Star;  - Bearish Evening Doji Star;  - Bearish/Bullish Doji Star;    - Bearish/Bullish Tri-Star;  - Bearish Hanging Man;  - Bearish/Bullish Harami;  - Bearish/Bullish Harami Cross;  - Bearish Two Crows;  - Bearish Identical Three Crows;  - Bearish Three Black Crows
Elliott Wave Trend MT5
Young Ho Seo
4 (3)
Elliott Wave Trend was designed for the scientific wave counting. This tool focuses to get rid of the vagueness of the classic Elliott Wave Counting using the guideline from the template and pattern approach. In doing so, firstly Elliott Wave Trend offers the template for your wave counting. Secondly, it offers Wave Structural Score to assist to identify accurate wave formation. It offers both impulse wave Structural Score and corrective wave Structure Score. Structural Score is the rating to sh
Andrews Trend Side MT5
Andrew Fedotov
3 (2)
Trend Side - 确定趋势的技术指标。它是一组成熟的交易策略。该指标使用先进的趋势过滤系统,有一个统计面板,计算进入和退出水平,并计算动态追踪止损水平。适用于任何类型的符号,从不重绘其信号和结果。专业趋势交易的综合工具。 趋势侧指标集还包括安德鲁斯趋势扫描仪 - 多货币和多时间框架趋势扫描仪、货币强度分析器、多时间框架趋势分析器,可分析可能的逆转。三个趋势分析仪内置于一个产品中。 购买指标后,请联系我免费获得安德鲁斯趋势扫描仪指标套件。 在我们的完整说明中更详细地描述了指示器和所有附加面板。本手册还详细描述了带有指标的交易策略、所有输入变量以及信号过滤。   [Download Instruction] 指标特点: - 通过过滤更高的时间框架来识别趋势,使用多时间框架扫描器来过滤趋势及其在 4 个时间框架的组合上的活动 - 区分真实趋势和小幅修正,借助货币强度分析了解整个市场正在发生的情况,了解所有货币对的价格走势以选择最佳 - 在一个窗口中使用多货币扫描仪、超过 10 对和所有时间框架分析整个市场 优点 : 适用于所有类型的市场 从不重绘结果 发送有关新信号的通知
The  Basic Candlestick Patterns  is a Multi-Symbol and Multi-Timeframe scanner for identifying candlestick patterns. it displays your chosen patterns on the chart and helps you make trade decisions. The indicator has simple settings for coloring and alerts. You can also activate or deactivate the desired patterns, symbols and timeframes. Bullish Patterns Hammer Inverse hammer Bullish engulfing Morning star Three white soldiers Bearish Patterns Hanging man Shooting star Bearish engulfing Ev
Automated Trendlines MT5
Georgios Kalomoiropoulos
趋势线是外汇交易中最重要的技术分析工具。不幸的是,大多数交易者没有正确绘制它们。自动趋势线指标是专业交易者的专业工具,可帮助您可视化市场的趋势运动。 有两种类型的趋势线看涨趋势线和看跌趋势线。 在上升趋势中,外汇趋势线是通过价格变动的最低摆动点绘制的。 连接至少两个“最低点”将创建一条趋势线。 在下跌趋势中,趋势线是通过价格走势的最高摆动点绘制的。 连接至少两个“最高点”将创建一条趋势线。 趋势线何时突破? 当看跌蜡烛收于看涨​​趋势线下方并且蜡烛的高点在趋势线上方时,看涨趋势线会被打破。 当看涨蜡烛收于看跌趋势线上方并且蜡烛的低点低于趋势线时,看跌趋势线会被打破。 趋势线何时删除? 当一根完整的蜡烛在看涨趋势线下方形成时,看涨趋势线将被删除。 当完整的蜡烛在看跌趋势线上方形成时,看跌趋势线将被删除。 您可以从输入参数更改看涨和看跌趋势线的颜色和宽度。
123模式 是最受欢迎,功能强大和灵活的图表模式之一。该模式由三个价格点组成:底部,峰值或谷值以及38.2%至71.8%之间的斐波纳契回撤位。当价格突破最后一个峰值或谷值时,该形态被认为是有效的,此时指标绘制箭头,发出警报并可以进行交易。 [ 安装指南 | 更新指南 | 故障排除 | 常见问题 | 所有产品 ] 清除交易信号 可自定义的颜色和尺寸 实施绩效统计 可定制的斐波那契回撤水平 显示适当的止损和获利水平 该指标可用于查找连续或反转形态 它是不可重涂和不可重涂的 它实现了电子邮件/声音/视觉警报 123模式 可以表现为连续或反转模式。为了简化操作,该指标使您可以选择要寻找哪种类型的形态,使其成为趋势或反转交易者的绝佳工具。 设置 将指标加载到任何图表时,将显示一组选项作为输入参数。如果您认为它们太多,请不要感到失望,因为参数被分组为不言自明的块。这就是每个参数块的作用。 幅度-幅度表示替代价格点之间的最小柱线量。要找到大图案,请增加幅度参数。要查找较小的模式,请减小幅度参数。 闵。回撤-形态中所需的最小斐波那契回撤。设置为零不对其进行评估。 最大。回撤-形态中可能
PZ Trend Trading MT5
PZ TRADING SLU
3.67 (3)
许多盈利交易者不仅知道如何识别市场趋势,而且也能把握趋势建立后的交易机会。 Pz 趋势交易 指标设计用来在趋势行情中尽可能的赚取利润。 已建立的趋势提供了一揽子交易机会,但大多数趋势交易指标完全忽视了它们,让交易者在趋势行情时完全不知道该如何做!一般趋势指标只通知有关的趋势变化,但根本不足以得到卓越的回报. Pz 趋势交易 指标比一般趋势指标显示多达 20 倍的交易 , 因为它注重所谓的市场时机。它不仅显示当前的市场趋势,也有回调,内柱线的突破和调整。它令您在趋势回调之后介入,安全的柱线内突破金字塔加仓,以及发现潜在的反转,和已知的调整。 趋势改变 一个趋势改变在市场方向变化时发生。趋势变化在图表上用带数字的彩色圆圈显示。蓝色 (1) 信号为上涨开始, 而红色 (1) 信号为下跌开始。趋势变化并非评估当前价格动作的结果, 它意味着交易设置是不定时地。如果您正确使用本指标, 在趋势变化时, 您将将已经入场 (参看下面的调整)。 回调 但凡趋势在运动中,行情上下抖动,盈利者收割利润,且其它参与者入场。趋势回调代表好的买入机会,通常是由主力获利离场导致。如果行情在回调后回归上行, 指
FanTracer
Syed Oarasul Islam
This Indicator draws Fibonacci Fan levels in two different ways. You can select whether to draw Fibonacci Fan levels based on your favourite ZigZag settings or you can let the indicator to draw Fan levels based on given number of bars or candles.  You can also set Mobile and Email notification for your favourite Fan  levels individually. With this indicator you will not have to feel lonely as the it can generate Voice alerts, which will keep you focused on your trading and remove boredom.  Prod
该指标在图表上显示谐波模式,无需以尽可能小的滞后 重新绘制。 指标顶部的搜索基于价格分析的波动原理。 高级设置允许您为您的交易风格选择参数。在蜡烛(柱)开盘时,当新形态形成时,价格变动可能方向的箭头是固定的,保持不变。 该指标识别以下形态及其品种:ABCD、Gartley(蝴蝶、螃蟹、蝙蝠)、3Drives、5-0、蝙蝠侠、SHS、One2One、骆驼、三角形、WXY、斐波那契、振动。默认情况下,设置中仅显示 ABCD 和 Gartley 数字。许多额外的可配置参数。 主要参数: ShowUpDnArrows - 显示/隐藏可能的方向箭头 ArrowUpCode - 向上箭头代码 ArrowDnCode - 向下箭头代码 Show old history patterns - 启用/禁用过时模式的显示 Enable alert messages, actual if history OFF - 启用/禁用模式出现/更改时的警报(仅在禁用历史记录时) Enable alert notification, actual if alert messages is enabled - 模式出现
Gartley Projections D
Oleksandr Medviediev
3 (2)
具有经过验证的概念和盈利能力的最佳、最有效、可靠的产品。感谢您的考虑。  该指标根据H.M.Gartley的发展(《股票市场利润》,1935年)识别和确认谐波模式(XABCD)。 它将D点投影为透视投影中的一个点(在设置中指定ProjectionD_Mode = true)。 不会重绘。当工作时间段的柱形图关闭时,如果已识别的模式点在Patterns_Fractal_Bars柱中未移动,则在图表上出现一个箭头(指向预期价格运动的方向)。从此刻起,箭头将永久保留在图表上。 注意:连续出现2-3个或更多箭头 - 这是市场条件的变化,而不是重绘。 总共有85种模式(包括Gartley-222和Gartley-222WS,完整列表可在评论部分的Google Drive链接中找到)。在所有已识别的模式中,只有最新识别的模式填充了单一颜色。 参数 DrawPatterns(true/false)- 以实心颜色绘制模式 ProjectionD_Mode(true/false)- 定义D点作为透视投影模式 Patterns_Fractal_Bars - 在认定为形成分形
Introduction Excessive Momentum Indicator is the momentum indicator to measure the excessive momentum directly from raw price series. Hence, this is an extended price action and pattern trading. Excessive Momentum Indicator was originally developed by Young Ho Seo. This indicator demonstrates the concept of Equilibrium Fractal Wave and Practical Application at the same time. Excessive Momentum detects the market anomaly. Excessive momentum will give us a lot of clue about potential reversal and
Noize Absorption Index
Ekaterina Saltykova
Noize Absorption Index - is the manual trading system that measures the difference of pressure between bears forces and bulls forces. Green line - is a noize free index that showing curent situation. Zero value of index shows totally choppy/flat market.Values above zero level shows how powerfull bullish wave is and values below zero measures bearish forces.Up arrow appears on bearish market when it's ready to reverse, dn arrow appears on weak bullish market, as a result of reverse expectation.
首先,值得强调的是,这个交易工具是非重绘、非重画和非滞后的指标,非常适合专业交易。 智能价格行动概念指标是一个非常强大的工具,既适用于新手,也适用于经验丰富的交易者。它将超过20个有用的指标合并到一个指标中,结合了高级交易思想,如内圈交易员分析和智能资金概念交易策略。该指标侧重于智能资金概念,提供有关大型机构交易方式的见解,帮助预测它们的动向。 它在流动性分析方面尤其擅长,有助于理解机构的交易方式。它擅长预测市场趋势,并仔细分析价格波动。通过将您的交易与机构策略对齐,您可以更准确地预测市场走向。该指标多才多艺,擅长分析市场结构,识别重要的订单区块,并识别各种模式。 它擅长识别BOS和CHoCH等模式,理解动量的转变,并突出显示供需强劲的关键区域。它还擅长发现强大的不平衡,并分析价格创造更高高点或更低低点的模式。如果您使用斐波那契回撤工具,该指标可以满足您的需求。它还可以识别相等的高点和低点,分析不同的时间框架,并通过仪表板显示数据。 对于使用更高级策略的交易者,该指标提供了工具,如公平价值差指标和优惠和折扣区域的识别。它特别关注高时间框架订单区块,并在较长时间框架内彻
Oscillator trading signals - это динамический индикатор, определяющий состояние к продолжению тенденции роста или падению цены торгового инструмента и отсечению зон с нежелательной торговлей. Индикатор состоит из 2 линий осцилляторов. Медленная и быстрая сигнальная линия.  Шкала отображения перевернутая. Зоны вблизи 0 свидетельствуют о тенденции роста цены валютной пары. Зоны -100 свидетельствуют о падении цены валютной пары. На основном графике в виде стрелок отображается потенциально выгодные
Girassol Sunflower MT5 Indicator
Saullo De Oliveira Pacheco
This is the famous Sunflower indicator for Metatrader5. This indicator marks possible tops and bottoms on price charts. The indicator identifies tops and bottoms in the asset's price history, keep in mind that the current sunflower of the last candle repaints, as it is not possible to identify a top until the market reverses and it is also not possible to identify a bottom without the market stop falling and start rising. If you are looking for a professional programmer for Metatrader5, please
Indicator and Expert Adviser  EA Available in the comments section of this product. Download with Indicator must have indicator installed for EA to work. Mt5 indicator alerts for bollinger band and envelope extremes occurring at the same time. Buy signal alerts occur when A bullish candle has formed below both the lower bollinger band and the lower envelope  Bar must open and close below both these indicators. Sell signal occur when A bear bar is formed above the upper bollinger band and upp
Atomic Analyst MT5
Issam Kassas
3.64 (11)
首先值得强调的是,该交易指标是非重绘、非延迟的指标,这使其成为手动和机器人交易的理想选择。 Atomic Analyst是一种PA价格行动指标,利用价格的力量和动量来寻找市场上更好的机会。配备了高级过滤器,可帮助去除噪音和假信号,并提高交易潜力。使用多层复杂的指标,Atomic Analyst扫描图表,并将复杂的数学计算转化为任何初学者都能理解并用来做出一致交易决策的简单信号和颜色。 “Atomic Analyst”是专为新手和经验丰富的交易者量身定制的综合交易解决方案。它将高级指标和一流功能融合为一体的交易策略,使其成为所有类型交易者的多功能选择。 日内交易和剥头皮策略:专为快速准确的日内交易和短期交易而设计。 日内和摆动交易策略:可用作追求价格大幅波动的日内和摆动交易者的可靠工具。 多货币和市场:凭借其可靠的精度,在不同的工具和市场上运作。 多个时间框架:可在多个时间框架上使用,性能良好。 稳定性:所有指标均不重绘、不重绘和不滞后,确保可靠的信号。 信号清晰度:提供箭头信号,用于清晰的入场和出场点。 实时警报:通过交易入场、SL和TP警报通知交易者。 多个利润水平:使用
Elevate Your Trading Experience with Wamek Trend Consult!   Unlock the power of precise market entry with our advanced trading tool designed to identify early and continuation trends. Wamek Trend Consult empowers traders to enter the market at the perfect moment, utilizing potent filters that reduce fake signals, enhancing trade accuracy, and ultimately increasing profitability.   Key Features: 1. Accurate Trend Identification: The Trend Consult indicator employs advanced algorithms and unparall
Renko Gold
Ignacio Agustin Mene Franco
Renko Gold! clearly indicates the floors and ceilings where it goes from 4 lines, the line below that marks the floor in green confirming with the thinnest line clarifies the purchase entry, the same is for sale, the top line marks the ceiling and the thinnest red line marks the sale, This indicator works for all temporalities! For Forex and Synthetic Indices markets! It also works for crypto markets! Good profit! World Investor.
How to use Pair Trading Station Pair Trading Station is recommended for H1 time frame and you can use it for any currency pairs. To generate buy and sell signal, follow few steps below to apply Pair Trading Station to your MetaTrader terminal. When you load Pair Trading Station on your chart, Pair Trading station will assess available historical data in your MetaTrader platforms for each currency pair. On your chart, the amount of historical data available will be displayed for each currency pai
PipFinite Trend PRO MT5
Karlo Wilson Vendiola
4.87 (664)
Breakthrough Solution For Trend Trading And Filtering With All Important Features Built Inside One Tool! Trend PRO's smart algorithm detects the trend, filters out market noise and gives entry signals with exit levels. The new features with enhanced rules for statistical calculation improved the overall performance of this indicator. Important Information Revealed Maximize the potential of Trend Pro, please visit www.mql5.com/en/blogs/post/713938 The Powerful Expert Advisor Version Automa
Liquidity Oscillator
Paolo Scopazzo
5 (1)
A powerful oscillator that provide Buy and Sell signals by calculating the investor liquidity. The more liquidity the more buy possibilities. The less liquidity the more sell possibilities. Please download the demo and run a backtest! HOW IT WORKS: The oscillator will put buy and sell arrow on the chart in runtime only . Top value is 95 to 100 -> Investors are ready to buy and you should follow. Bottom value is 5 to 0 -> Investors are ready to sell and you should follow. Alert + sound will app
DYJ超级趋势波是一个高度准确的波峰波谷交易系统。 这个指标在进出市场时寻找蜡烛线的最高点和最低点。 入口价格在最高点或者最低点附近. 信号的通知类型已被添加到DYJ超级趋势波。 当产生多空间信号时, 可以使用以下类型的通知信号: Alert mailSend MobilePush 参数 InpSignalPeriod = 10 BarDistance = 24 InpIsAlert = true ========================== DYJ SuperTrendWave is a highly accurate trading system. This indicator looks for the highest and lowest points of candles as entering and leaving the market. The notification type of signal has been added to the dyj supertrend. When a multi-space signal is generated, T
Price Breakout pattern Scanner is the automatic scanner for traders and investors. It can detect following patterns automatically from your chart. Head and Shoulder - Common tradable pattern. Reverse Head and Shoulder - This pattern is the reverse formation of the Head and Shoulder. Double Top - When the price hits resistance level twice and decline toward the support level, the trader can anticipate sudden bearish breakout through the support level. Double Bottom - The double bottom pattern is
Double HMA MTF for MT5
Pavel Zamoshnikov
5 (2)
This is an advanced multi-timeframe version of the popular Hull Moving Average (HMA) Features Two lines of the Hull indicator of different timeframes on the same chart. The HMA line of the higher timeframe defines the trend, and the HMA line of the current timeframe defines the short-term price movements. A graphical panel with HMA indicator data from all timeframes at the same time . If the HMA switched its direction on any timeframe, the panel displays a question or exclamation mark with a tex
Modified Bollinger Bands
Gennadiy Stanilevych
The standard Bollinger Bands indicator has been improved by integrating additional indications from the Standard Deviation indicator (StdDev), which gives an additional filter for confirming trading signals. In addition, the color of the indicator's lines shows the beginning of a trend, its development and exhaustion. This indicator has a signal block that notifies the trader of the beginning of the trend on any time frame to which it is attached. Settings Type of messages - select the type of
Point Black
Ignacio Agustin Mene Franco
Black Card Pack indicator 5/1 point black It has the strategy of professional bollingers where each arrow gives you a different entry signal. It is used to operate in m1 and in d1 It is used for scalping and intraday, modified for forex markets ! suitable for all pairs modified for synthetic index markets suitable for all pairs! Ideal for volatility and jumps!
Distinctive MT5
Tatiana Savkevych
Distinctive is a forex trending arrow indicator for identifying potential entry points. I like it, first of all, because it has a simple mechanism of work, adaptation to all time periods and trading tactics. Created on the basis of a regression channel with filters. Plotting the Lawrence indicator signals on a price function chart using a mathematical approach. How it works - when the price breaks out in the overbought / oversold zone (channel levels), a buy or sell signal is generated. Every
该产品的买家也购买
Bill Williams Advanced
Siarhei Vashchylka
5 (3)
Bill Williams Advanced is designed for automatic chart analysis using Bill Williams' "Profitunity" system. The indicator analyzes four timeframes at once. Manual (Be sure to read before purchasing) Advantages 1. Automatically analyzes the chart using the "Profitunity" system of Bill Williams. The found signals are placed in a table in the corner of the screen. 2. Equipped with a trend filter based on the Alligator indicator. Most of the system signals are recommended to be used only accordi
TrendMaestro5
Stefano Frisetti
note: this indicator is for METATRADER4, if you want the version for METATRADER5 this is the link:  https://www.mql5.com/it/market/product/108106 TRENDMAESTRO recognizes a new TREND in the bud, he never makes mistakes. The certainty of identifying a new TREND is priceless. DESCRIPTION TRENDMAESTRO identifies a new TREND in the bud, this indicator examines the volatility, volumes and momentum to identify the moment in which there is an explosion of one or more of these data and therefore the mome
Professional Scalping Tool on Deriv Attention! The indicator will be sold in limited quantities!!! Description: This trading indicator is designed for professional traders focused on scalping. Designed with the market in mind, it provides highly accurate spike trading signals. It works on the M1 timeframe and supports the following symbols: Boom 300 Index, Boom 500 Index, Boom 1000 Index, Crash 300 Index, Crash 500 Index, Crash 1000 Index. Functional Features: - Direction: - Trading is ca
IVISTscalp5
Vadym Zhukovskyi
5 (3)
我们向您介绍iVISTscalp5指标,它不仅独特,而且在交易操作中也非常有效。该指标基于时间数据,是多年金融市场经验和深入分析的结果。iVISTscalp5指标是手动交易的优秀工具。便利性、简单性和可视化 - 所有的复杂性都隐藏在内部。我们将iVISTscalp5指标的设置和使用简化到了最大程度。该指标适用于MT5终端中您所拥有的所有金融工具。 操作时间为UTC+3的早上4点到晚上8点。 iVISTscalp5指标菜单(见截图1): History - 计算行情的周数 dT_min - 选择时间间隔的时间(分钟) TFline - 绘制水平成交量(时间帧) BARSline - 绘制水平成交量(条数) TFtrend1 - 绘制日线通道(时间帧) BARStrend1 - 绘制日线通道(条数) TFtrend2 - 绘制周线通道(时间帧) BARStrend2 - 绘制周线通道(条数) ALERT_TIMER - 设置闹钟 ALERT - 开启/关闭闹钟 Save - 开启/关闭将时间记录到文本文件。 图表上的红色和蓝色旗帜表示时间(VIST智能剃须系统的信号)。卖出信号为红旗,买入
VTrende Pro
Andrii Diachenko
5 (1)
VTrende Pro - MTF indicator for trend trading with a display panel for MT5 *** Videos can be translated into any language using subtitles (video language - Russian) Although the signals of the VTrende Pro indicator can be used as signals of a full-fledged trading system, it is recommended to use them in conjunction with the Bill Williams TS. VTrende Pro is an extended version of the VTrende indicator. Difference between Pro version and VTrende: - Time zones - Signal V - signal 1-2 waves
PZ Swing Trading MT5
PZ TRADING SLU
5 (4)
Swing Trading 是第一个旨在检测趋势方向的波动和可能的反转波动的指标。它使用在交易文献中广泛描述的基准摆动交易方法。该指标研究多个价格和时间向量,以追踪总体趋势方向,并检测市场超卖或超买并准备好进行修正的情况。 [ 安装指南 | 更新指南 | 故障排除 | 常见问题 | 所有产品 ] 市场波动的利润不会被窃取 指示器始终显示趋势方向 彩色价格带代表机会基准 彩色虚线表示可能的反转波动 该指标分析其自身的质量和性能 它实现了一个多时间仪表板 可定制的趋势和波动周期 它实现了电子邮件/声音/推送警报 指示器为非重涂或重涂 什么是摇摆交易 摇摆交易是一种尝试在一天到一周内从证券中获得收益的交易方式,尽管某些交易最终可以保持更长的寿命。摇摆交易者使用技术分析来买入弱点和卖出力量,并有耐心等待这些机会的发生,因为在发生一波抛售浪潮之后购买证券而不是陷入抛售更有意义。 机会基准 关于历史数据的大量研究证明,适合于波动交易的市场倾向于在基线价格带上下交易,基线价格带由图表显示,使用平均真实区间计算得出。波动交易者使用基线,该策略是购买常态和卖出躁狂,或做空常态并掩盖沮丧。
SMCpro
Arief
5 (1)
SMCpro MT5  Original Price  $440   ---  Currently Price  40% OFF  ( for unlimited use ) Hello World! Introducing.. SMCpro tool and Indicator for  MetaTrader 5 , a cutting-edge feature designed to revolutionize your trading experience. With innovative ICT Smart Money Concept, you gain unparalleled insight into market dynamics, empowering you to make informed trading decisions like never before. Built on the foundation of advanced algorithms and real-time data analysis, SMCpro tool and Indicat
Weis Wave with Alert MT5
Trade The Volume Waves Single Member P.C.
4.93 (15)
Rental/Lifetime Package Options and Privileges  * For optimum results the yearly or lifetime package is suggested due to live training ! Rent Monthly Six Months   Yearly/Lifetime Weis Wave with Speed with Alert+Speed Index x x x Manual  x x x Quick Set up Video x x x Blog x x x Lifetime Updates x x x Setup and Training Material x x Free Rectangle Break Alert Tool      x Discord Access Channel "The SI traders" x 2-hour live methodology training x How to trade with it:    http://
PZ Harmonacci Patterns MT5
PZ TRADING SLU
3.25 (4)
可以说,这是您可以为MetaTrader平台找到的最完整的谐波价格形成自动识别指标。它检测19种不同的模式,像您一样认真对待斐波那契投影,显示潜在的反转区域(PRZ),并找到合适的止损和获利水平。 [ 安装指南 | 更新指南 | 故障排除 | 常见问题 | 所有产品 ] 它检测19种不同的谐波价格形态 它绘制了主要,衍生和互补的斐波那契投影(PRZ) 它评估过去的价格走势并显示每个过去的形态 该指标分析其自身的质量和性能 它显示合适的止损和获利水平 它使用突破来表明合适的交易 它在图表上绘制所有样式比率 它实现了电子邮件/声音/视觉警报 受斯科特·M·卡尼(Scott M. Carney)的书的启发,该指标旨在满足最纯粹和最熟练的交易者的需求。但是,它采取了一种使交易更容易的方式:在向交易发出信号之前,它会等待Donchian朝正确方向突破,从而使交易信号非常可靠。 斐波那契投影与向量无关 它实现了电子邮件/声音/推送警报 它绘制了ABCD投影 重要提示: 为了符合 Scott M. Carney先生 的商标申诉,某些图案名称已重命名为不言自明的替代方式, Scot
RAD Real Acummulation and Distribution
Jose Alejandro Jacome Jimenez
RAD CRITICAL LEVES RAD indicator tracks “Relevant Volume” in real time, identifying accumulation and distribution processes, projecting them in the chart as SUPPORT or RESISTANCE zones. Natural   support   and resistance levels are generated by Volume Accumulation and Distribution processes. As these processes evolve, levels at which the relevant volume in the market place is positioned, become difficult areas to cross upwards or downwards. By using this information, traders can identify very s
PZ Divergence Trading MT5
PZ TRADING SLU
3.75 (4)
棘手的发现和频率稀缺是最可靠的交易方案之一。该指标使用您喜欢的振荡器自动查找并扫描常规和隐藏的发散。 [ 安装指南 | 更新指南 | 故障排除 | 常见问题 | 所有产品 ] 容易交易 发现常规和隐藏的分歧 支持许多知名的振荡器 根据突破实现交易信号 显示适当的止损和获利水平 可配置的振荡器参数 可自定义的颜色和尺寸 按条形过滤大小差异 实现绩效统计 它实现了电子邮件/声音/视觉警报 为了提供广阔的市场前景,可以使用不同的振荡器在同一张图表中多次加载该指标,而不会产生干扰。该指标支持以下振荡器: RSI CCI MACD OSMA 随机 动量 很棒的振荡器 加速器振荡器 威廉姆斯百分比范围 相对活力指数 由于差异可能会扩大很多,尤其是在外汇市场中,因此该指标产生了转折:它在等待交易突破之前等待donchian突破确认差异。最终结果是带有非常可靠的交易信号的重新粉刷指示器。 输入参数 幅度:用于寻找差异的之字形周期 振荡器-选择要加载到图表的振荡器。 突破期-交易信号的突破期,以柱为单位。 发散类型-启用或禁用发散类型:隐藏,常规或两者。 最小散度单位为条形-最
"Piranha" - an autonomous trading system that determines overbought and oversold levels on the chart. Red and blue zones represent overbought and oversold levels respectively. Entry points are marked with arrows: a downward arrow in the red zone for "sell" and an upward arrow in the blue zone for "buy". The Take profit level is indicated by the green moving average. Key features: Adjusting the Take profit level as the green moving average changes position. Averaging ability when a new market e
Big Player Range
Thalles Nascimento De Carvalho
5 (2)
欢迎使用"BigPlayerRange"指标,这是一款技术分析工具,旨在识别市场中金融机构关注的重要区域。该指标提供了对大型市场参与者表现出相当活跃和关注的价格范围的精确分析。 主要特点: 1. 机构兴趣区域映射: "BigPlayerRange" 准确地突出显示金融机构表现出强烈活动的图表区域。这些点具有战略重要性,提供了对可能市场走势的见解。 2. 投影作为退出参考:除了识别关注区域,该指标还使用投影作为两个不同阶段可能退出的参考。这些投影帮助投资者基于未来可能的价格方向规划策略。 3. 返回到识别范围时的回撤概率: "BigPlayerRange" 的一个独特功能是当价格返回到关注范围时计算回撤概率。这有助于评估潜在的趋势反转。 如何使用 "BigPlayerRange": - 辨识关注区域:使用该指标辨识金融机构活动较多的区域。这些点可能对于预测重大波动至关重要。 - 投影作为退出参考:在计划市场退出时,使用投影作为参考。这些投影提供在关闭仓位时可能价格方向的见解。 - 评估回撤概率:在价格返回到已识别范围时注意回撤的概率。这有助
AI Binary Sniper
Angelo Capoferri
基於人工智慧的指標,可產生二元期權的可能的看漲期權和看跌期權條目。 此指標適用於 3 種不同的策略: 1) 透過讀取交易量,它會在價格應該反轉時發出訊號 2)透過價格和成交量之間的背離,發出趨勢何時繼續或反轉的信號 3)透過價格和成交量之間的收斂,它發出了趨勢何時應該繼續的信號。 此指標適用於所有時間範圍,但在 3 分鐘或 5 分鐘期限內獲得最佳結果(因為在低時間範圍內會出現機構攻擊)。 最佳時間是流動性較大的時間,即格林威治標準時間 7 點至 18 點。 雖然該指標產生超過 70% 的正確訊號,但您可能會遇到操縱價格或相互排斥的機構之間的爭鬥,從而產生一系列錯誤訊號,因此我們建議使用充分的資金管理(例如 Masaniello )...
Harmonic ABCD Monitor MT5
Mihail Matkovskij
5 (2)
Multi-currency, multi-timeframe, harmonic pattern indicator AB = CD. Supports sending push notifications about signals to a mobile device, messages on e-mail, as well as messages using alerts on all available currency pairs and timeframes. This indicator was based on the indicator Harmonic ABCD Universal. Version for MetaTrader 5:  https://www.mql5.com/en/market/product/44972 . See also: Harmonic ABCD Universal for MetaTrader 4 . Using modern software development methods has made the indicator a
Ershov 38 parrots MT5
Aleksei Ershov
5 (1)
The indicator is designed to close positions on the market in time. For example: to take profits ahead of schedule if the price has not reached TakeProfit, and the market is turning around. The indicator analyzes the momentum, not the trend. He does not give any information about the trend. The indicator is well suited for finding divergence. The Ershov 38 Parrots indicator dynamically adjusts to the market and detects price movement impulses of medium and high amplitude. It almost does not rea
Elliot Waves Analyzer Pro
Viktor Weidenthal
3.25 (4)
Elliot Waves Analyzer Pro calculates Elliot Waves to Help Identify Trend direction and Entry Levels. Mainly for Swing Trading Strategies. Usually one would open a Position in trend direction for Wave 3 or a Correction for Wave C . This Indicator draws Target Levels for the current and next wave. Most important Rules for Elliot Wave Analysis are verified by the Indicator.  The Pro version analyzes Multiple Timeframes and shows the Subwaves and Target-Levels.   For an Overview  " Elliot Waves Anal
PZ Day Trading MT5
PZ TRADING SLU
2.83 (6)
该指标仅使用价格行为分析和donchian渠道以锯齿形检测价格反转。它是专门为短期交易而设计的,根本不需要重新粉刷或补漆。对于精明的交易者来说,这是一个绝佳的工具,旨在增加他们的运作时间。 [ 安装指南 | 更新指南 | 故障排除 | 常见问题 | 所有产品 ] 极易交易 它在每个时间段都提供价值 实施自我分析统计 它实现了电子邮件/声音/视觉警报 基于可变长度的突破和拥挤区域,该指标仅使用价格行为来选择交易并对市场快速做出反应。 显示过去信号的潜在利润 该指标分析其自身的质量和性能 突围的损失突出显示并解决 该指标是不可重涂和不可重涂的 该指标将帮助盘中交易者不要错过单个价格反转。但是,并非所有价格反转都是一样的,也不是具有相同的可行质量。决定要突破哪些突破而忽略哪些取决于交易者的良好判断。 如何解释统计数据 该指标研究其自身信号的质量,并在图表上绘制相关信息。将分析每笔交易,并在图表的左上角显示总体历史结果,这使您可以针对任何给定的工具和时间范围自行优化指标参数。每个乐器和时间表都有其自己的最佳设置,您可以自己找到它们。 最大优惠交易:对于任何给定的交易,MFE都是
Tatino Super Signals is Non Repaint Indicator for Binary Option trading and Forex trading. Recommendations: Timeframe: All timeframes. For best results we recommend using it on M1, M5 and M15 timeframes. Currency pairs: All Pairs Account type: All Type Broker time: Any Brokers : Alls Binary Trading : Expired 1 Candle Buffer Buy=1, Sell=0, Entry Next Candle Recommended Forex trading stop loss : 15 pips Recommended  Forex tradingTake profit levels : 15 pips Specifications: Does not repaint  
Smooth price for Monarch
Konstantin Gruzdev
5 (1)
The Smooth Price technical indicator is used for plotting a smoothed line as close to the price of the financial instrument as possible, and serves to eliminate its noise components. The indicator is part of the Monarch trading system, but here it is presented as an independent technical analysis tool. The indicator is based on the cluster digital filter , which, unlike the ClusterSMA , is applied directly to the price time series. Smooth Price does not redraw (except the very last, zero bar) an
PZ Mean Reversion MT5
PZ TRADING SLU
3 (2)
采用专业和量化方法进行均值回归交易的独特指标。它利用了价格以可预测和可衡量的方式转移并返回均值这一事实,这允许明确的进入和退出规则大大优于非量化交易策略。 [ Installation Guide | Update Guide | Troubleshooting | FAQ | All Products ] 清晰的交易信号 非常容易交易 可定制的颜色和尺寸 实现性能统计 优于大多数交易策略 显示合适的止损和止盈水平 它实现了电子邮件/声音/视觉警报 这个怎么运作 该指标从更高的时间范围测量完全可定制的移动平均线的标准偏差,并使用趋势跟踪方法精确地找到交易。交易是通过深入当前图表的价格行为发现的,并在价格返回到平均价格区间时关闭,根据您选择的更高时间范围计算。由于其编码方式,该指标将远离高波动性和强劲趋势市场,并且仅在可预测的情况下进行交易,在可接受的波动性与方向性比率范围内,回归均值是可行的。 指标剖析 绿线是更高时间范围内的移动平均线(也就是平均值) 虚线区域是移动平均线周围的典型价格区间 蓝线是看涨交易的突破价格 红线是看跌交易的突破价格 交易是针对均值进行的,并在
ZigZag de Suavizador
Cesar Juan Flores Navarro
Teniendo una entrada de precios suavizados, los cuales son procesador por un ZigZag en tiempo real, dando como resultado un suavizador ajustado a un ZigZag. Con valores de entrada (periodo) mayores se vuelve un poco lenta en M1,, Ideal para H1, H4, D1 Trabaja bien con otros suavizadores, ya que su intersección es ideal Al iniciar empiza con mayor precisión desde el momento de activación, siendo el historial (anterior) de referencia ----------------------------------------------------------------
Recommended TimeFrame >= H1. 100% Non Repainted at any moment.  Use it carefully, only with Trend Direction. Trading Usage: 2 Variants: as Range System or as BreakOut System (Both Only With Trend Direction)::: (Always use StopLoss for minimise Risk); [1] as Range System: (Recommended) in UP TREND:  - BUY in Blue Line , then if price goes down by 50 points (on H1) open Second BUY.   Close in any Profit you wish: TrailingStop(45 points) or Close when Price touches upper Gold Line. in DOWN TR
[ MT4 Version ] Order Block Indicator MT5 Order Block Indicator MT5 is currently the most accurate and customizable indicator in the market. It has been developed to facilitate the analysis of operations based on Order Blocks and Supply and Demand Zones. These zones are possible reversal points of a movement. Order Blocks indicate a possible accumulation of orders in one area. The price usually gets to reach and react strongly to those areas. The most relevant levels for this reaction are the c
Super Suavizador
Cesar Juan Flores Navarro
Indicador en MQL5 que obtiene el promedio de 10 EMAS que son alineadas y procesadas según Fibonacci luego el promedio es suavizado"  Se ingresa un número de 2 a N que multiplica los EMA-Fibonacci y por consiguiente aumenta los fibonacci, resultando un promedio.   Se ingresa un número que suaviza los EMA-Fibonacci. Considerando los números 1/1 seria la suavización minima. Considerando los números 3/5 seria la suavización media. Considerando los números 10/30 seria la suavización alta.....etc
Entry Pro
Bartlomiej Tadeusz Tomaja
Entry Pro Indicator is a powerful multi-functional trading tool designed to increase your market entry accuracy. It combines the power of several key market trend indicators, including ATR Trailing Stop and both fast and slow EMA, to provide comprehensive market insight. It offers easy-to-interpret market entry signals represented by colored arrows. Also, it's fully customizable, allowing you to adjust ATR and EMA periods to suit your trading strategy. Trend filters and alerts can be toggled on
SMT Divergences MT5
Diego Arribas Lopez
MT4 Version SMT Divergences MT5 SMT Divergences is one of the most innovative indicators in the market. It offers the possibility of analyzing price divergences between 2 pairs. These divergences highlight and help to foresee what banks and institutions are planning to do. SMT divergences also provides you with a kill zones indicator and the possibility of filtering divergences occurring during these kill zones.  This indicator is specially powerful if applied in 2 highly correlated pairs. A pr
WanaScalper
Isaac Wanasolo
1 (1)
A scalping indicator based on mathematical patterns, which on average gives signals with relatively small SL, and also occasionally helps to catch big moves in the markets (more information in the video) This indicator has three main types of notifications: The first type warns of a possible/upcoming signal on the next bar The second type indicates the presence of a ready signal to enter the market/open a position The third type is for SL and TP levels - you will be notified every time price r
BookMap HeatMap
Roberto Spadim
1 (3)
This Indicator creates a heatmap based on depth of market of the current symbol or another symbol. Other symbol is useful when you trade futures market and a contract has 'mini' and 'full' split. For example, in Brazil (B3 - BMF&Bovespa), WDO and DOL are future Forex contract of BRL/USD (where 1 DOL = 5 WDO) and big banks work mostly with DOL (where liquidity is important). Please use with M1 timeframe , objects are too small to be displayed at higher timeframes (MT5 limit). The number of level
Классификатор силы тренда. Показания на истории не меняет. Изменяется классификация только незакрытого бара. По идее подобен полной системе ASCTrend, сигнальный модуль которой, точнее его аппроксимация в несколько "урезанном" виде, есть в свободном доступе, а также в терминале как сигнальный индикатор SilverTrend . Точной копией системы ASCTrend не является. Работает на всех инструментах и всех временных диапазонах. Индикатор использует несколько некоррелируемых между собой алгоритмов для класси
作者的更多信息
RSIhtf
Aleksei Grebenkin
Simple RSI indicator. User can choose TimeFrame for the RSI. For example, you are using chart with M5 data but want to see RSI from different fimeframe H4 drawn below the main chart window. RSIhtf.ex5(iRSI.ex5 - another name) (h = higher, tf = timeframe) is designed specifically for this case. Exports 1 buffer with indicator data. The indicator is part of TS_DayTrader system.
FREE
Сonverter for historical data files(TICKS) from external sources like ducascopy or others sources of non-standard .csv quotes. The output format is compatible with MetaTrader5 and can be imported to MetaTrader5. The script can process multiple files(batch), see parameter "Convert all files in folder Files/FrankEditor". User can choose output timeframe, months and other options. Input files should contain raw tick data and look like(UTC or EET time): GBPUSD_Ticks_2014.01.01_202
FREE
Сonverter for historical data files(2 files, Ask and Bid) from external sources like ducascopy or others sources of non-standard .csv quotes. The output format is compatible with MetaTrader5 and can be imported to MetaTrader5. The script can process multiple files(batch), see parameter "Convert all files in folder Files/FrankEditor". User can choose output timeframe, specific months and other options. 2 input files should look like(UTC or EET time): GBPUSD_1 Min_Ask_2017.01.01
FREE
Frankenstein
Aleksei Grebenkin
Multifunctional universal trading system . Suitable for all Forex and Crypto markets. ----   Frankenstein.ex5 [GUI VERSION], provides with graphical interface for TS_DayTrader Trading System. Features an extensive array of tools for manual and automated trading. For optimization capabilities, see Frank.ex5 [VERSION FOR OPTIMIZATION] - version for the MT5 Tester. Both Frankenstein.ex5 and Frank.ex5 have automatic trading capabilities. Parameters(.set files) for Frank.ex5 and Frankenst
Frank
Aleksei Grebenkin
Multifunctional universal trading system . Suitable for all Forex and Crypto markets. ----   Frank.ex5 [VERSION FOR OPTIMIZATION], fast engine for optimization of TS_DayTrader Trading System. Designed specifically for high-speed optimization in MT5 Tester. For [GUI VERSION] with graphical interface, see Frankenstein.ex5 . Both Frankenstein.ex5 and Frank.ex5 have automatic trading capabilities. Parameters(.set files) for Frank.ex5 and Frankenstein.ex5 are interchangeable.   Support
Franken
Aleksei Grebenkin
Multifunctional universal trading system . Suitable for all Forex and Crypto markets. ---- Franken.ex5 is additional executable used for trading with TS_DayTrader system. See the GUI version Frankenstein.ex5 and fast Frank.ex5 engine for optimization. You will find more info on the system in the descriptions there. Franken is built with features from both Frankenstein.ex5 and Frank.ex5: it is almost as fast as Frank(many features stripped off) but has the controls and statistics
IRSI Divergences
Aleksei Grebenkin
Signal provider based on RSI Divergences from a higher timeframe. First 3 buffers export a signal. Timeframe for which divergences are detected is optional, see 'RSI divergences timeframe' parameter. The indicator uses different algorithms for divergences detection: 'Fast' algorithm is the simplest solution that works the fastest. 'Strict' algorithm filters out more noise but works slower than the previous one. 'Full' algorithm uses recursive functions and provides with lots of d
IPatterns
Aleksei Grebenkin
Indicator iPatterns.ex5 detects 8 different classes of volatility patterns. DD, SD, RD, SSD are the so-called "bottoms". DV, SV, RV, SSV are "peaks". User can set up an Alert to be notified about a new pattern detected. Parameters 'Pattern maximal height' and 'Pattern minimal height' work as filters. 'iBB period' and 'iBB deviation' parameters regulate performance of BollingerBands indicator - it provides one of the signals forming already mentioned above 8 patterns. iPatter
筛选:
无评论
回复评论
版本 4.53 2022.08.16
--- Version 4.53 Build 0001 - stable?

Parameter 'Slippage' now is a ulong.
Parameter IP_Slippage_SIG_value // Slippage: use teSIG value for the first try
Telemetry(in "Experts") for the position calculation, before and after
Changes in description to better satisfy MQL5 Market Rules of Service
Prioritization of "Deal open" for telegram
iRSI version for Market
iRSI_Div version for Market
iPatterns version for Market
Bars/Ticks Scripts adapted to Market