AW Candle Patterns
- 指标
- AW Trading Software Limited
- 版本: 1.0
- 激活: 15
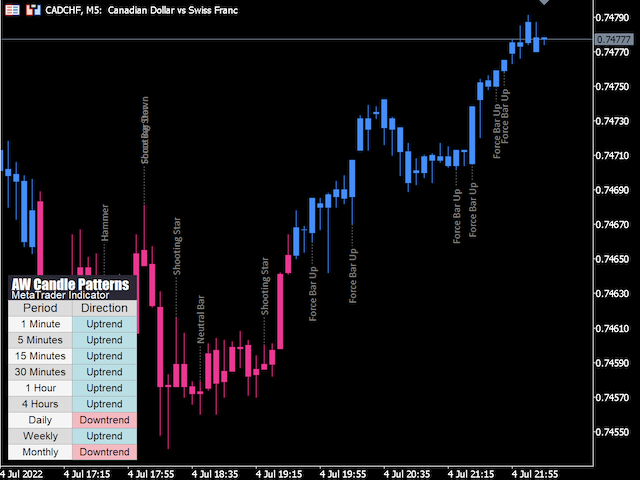
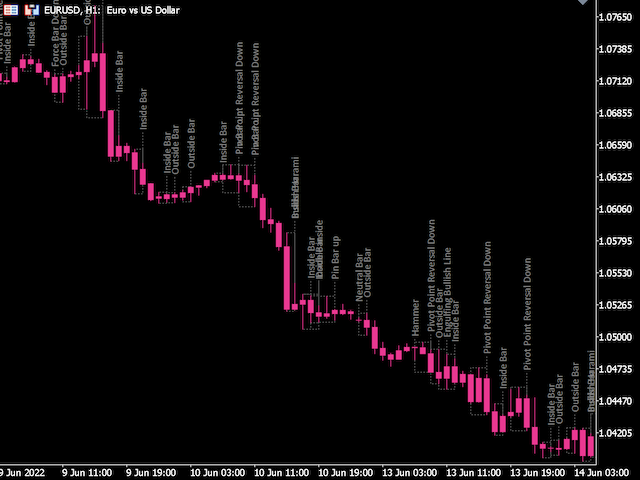
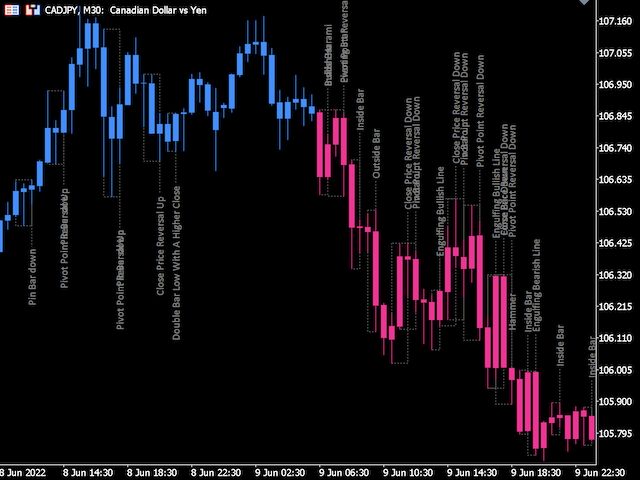
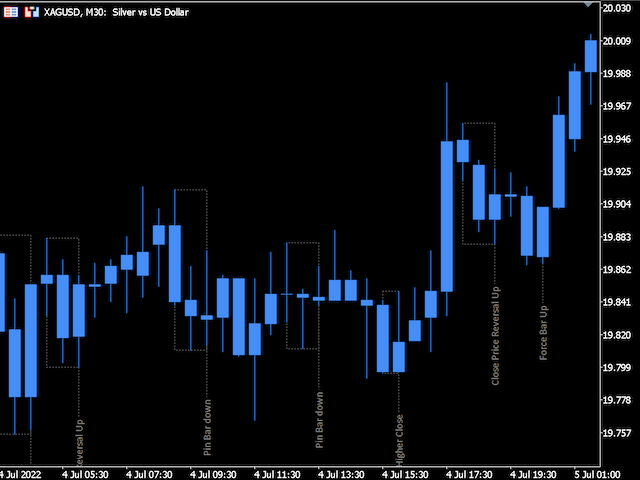
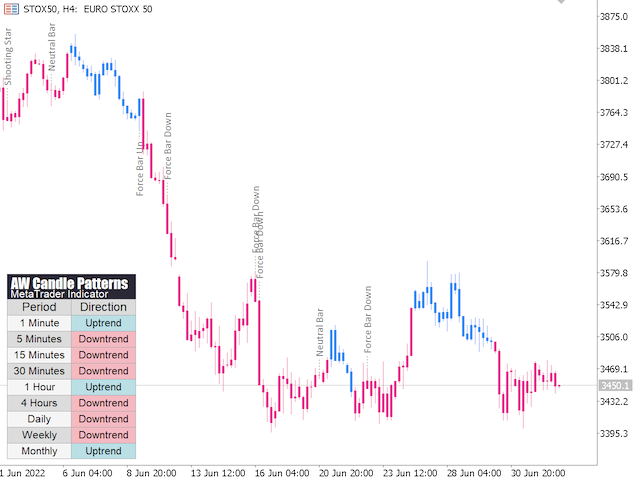
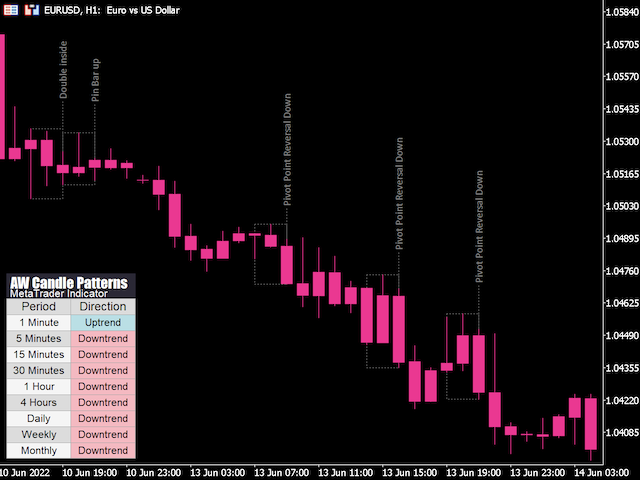
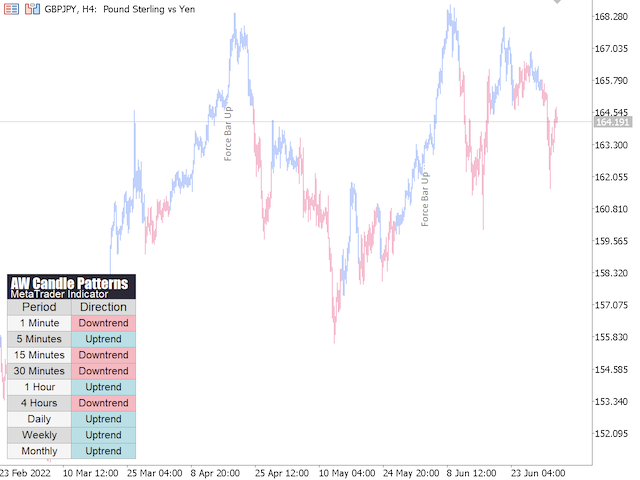
AW 蜡烛形态指标是高级趋势指标与强大的蜡烛形态扫描仪的组合。它是识别和突出显示 30 个最可靠的烛台形态的有用工具。此外,它是一个基于彩色条的电流趋势分析器,带有 可调整大小和定位的插件多时间框架趋势面板。根据趋势过滤调整模式显示的独特能力。
优点:
- 轻松识别蜡烛形态
- 不重绘结果
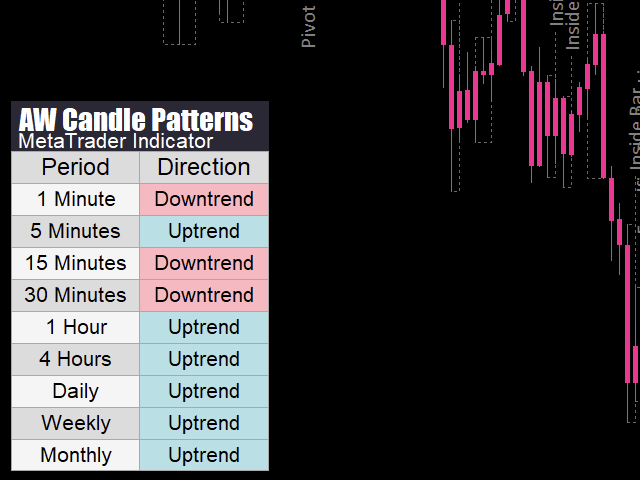
- 内置多时间趋势面板
- 禁用模式类型(1、2、3 根蜡烛)
- 显示形态时趋势过滤的调整
显示模式列表:
锤模式
固定/固定
看跌 Harami / 看涨 Harami
看跌 Harami Cross / 看涨 Harami Cross
枢轴点反转向上/枢轴点反转向下
双柱低位收盘价较高/双柱低位收盘价较低
收盘价反转向上 / 收盘价反转向下
中性条 / 两个中性条
双内/内/外
向上推力杆/向下推力杆
晚星/晨星
晚上十字星 / 早上十字星
吞没看跌线/吞没看涨线
镜子酒吧
流星
乌云盖顶
十字星
输入变量:
Main settings
Trend Filtering Mode - Adjustment of trend filtering when displaying patterns
Pattern by trend - Display only patterns following the trend
Patterns against trend - Display only patterns directed against the current trend
Do not check trend - Display patterns directed in the direction of the trend and against the trend.
Trend Filter period - Trend filter period. The greater the value of the
Show one candle patterns - Adjust the display of one-candle patterns
Enable two candles patterns - Adjust the display of two candles patterns
Enable three candles patterns - Adjust the display of three candles patterns
Max Bars - The maximum number of bars to calculate the indicator
Graphics Settings
Font size in panel - Adjust the text size in the indicator panel
Y offset - Position of the panel along the Y axis
X offset - Panel location along the X axis
Uptrend Color Panel - Color for displaying an uptrend in the panel
Downtrend Color Panel - Color for displaying a downtrend in the panel
ShowPanel - View of the panel on the chart:
Do not show panel - Option to work without a multi-timeframe panel
Show medium panel - Show medium panel
Show big panel - Show big panel (for high resolution screens)
Show Pattern text - Show or hide text when showing patterns
Font size - Adjust the text font size on the chart
Patterns text color - Text display color when displaying patterns
Font name - Font style adjustment for pattern text