Watermark Centralized
- 指标
- Ronnie Ferreira Silva
- 版本: 1.20
- 更新: 15 六月 2022
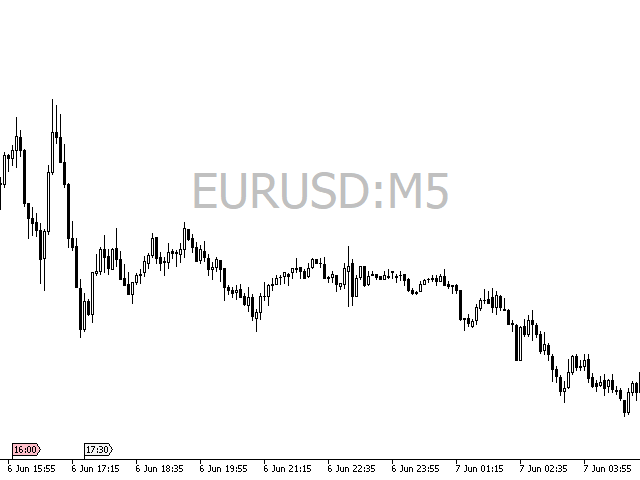
Watermark Centralized
Adds a watermark centered with the asset name and chosen period.
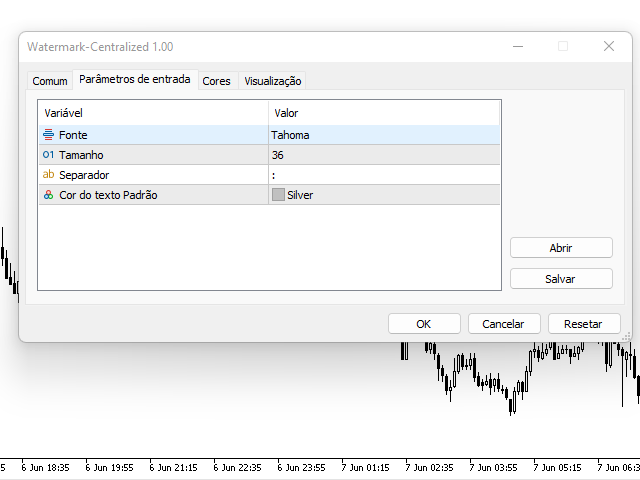
It is possible to override the font type, font size, font color and separator character.
The watermark is positioned behind the candles, not disturbing the visualization.
It has automatic re-centering if the window is resized.
Hope this indicator helps you, good trading ;)
用户没有留下任何评级信息