MetaBands M5
- 指标
- Vahidreza Heidar Gholami
- 版本: 1.9
- 更新: 21 九月 2023
- 激活: 10
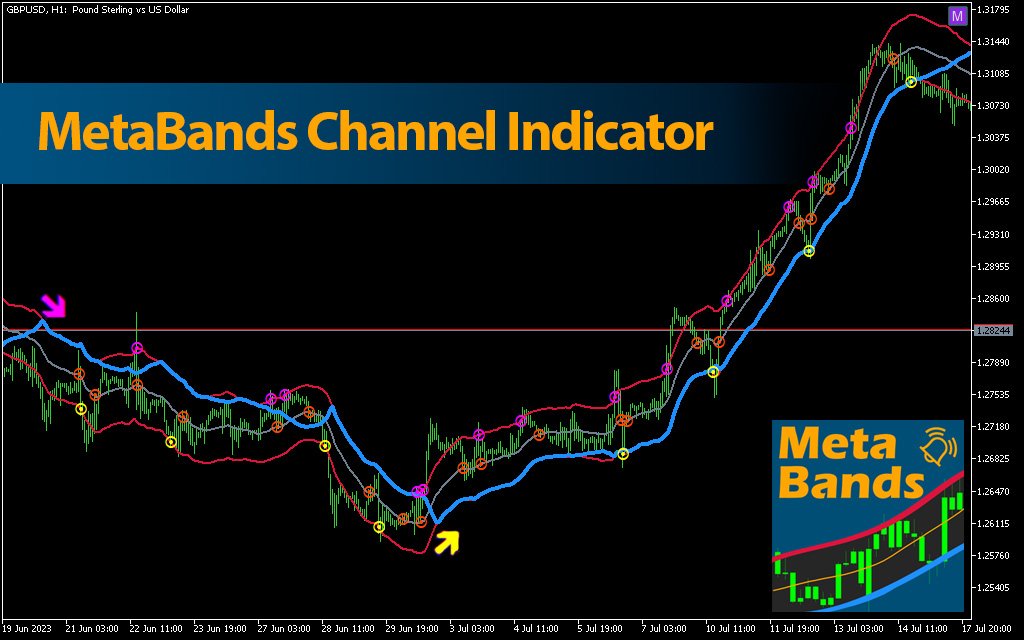
MetaBands使用强大且独特的算法绘制通道并检测趋势,以便为交易者提供进出交易的潜在点。它是一个通道指标和强大的趋势指标。它包括不同类型的通道,可以通过使用输入参数简单地合并以创建新通道。MetaBands使用所有类型的警报通知用户市场事件。
功能
- 支持大多数通道算法
- 强大的趋势检测算法
- 能够合并不同类型的通道
- 多时间帧和多货币(信号矩阵)
- 所有类型的警报功能(声音、屏幕闪烁、推送通知、电子邮件、弹出窗口、箭头)
- 它永远不会重绘
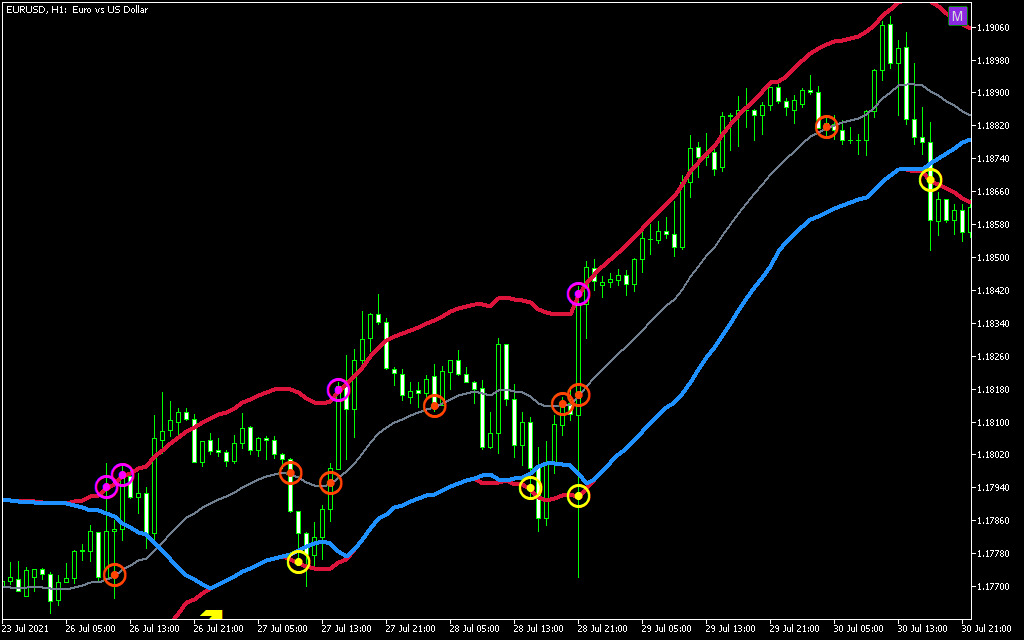
趋势检测
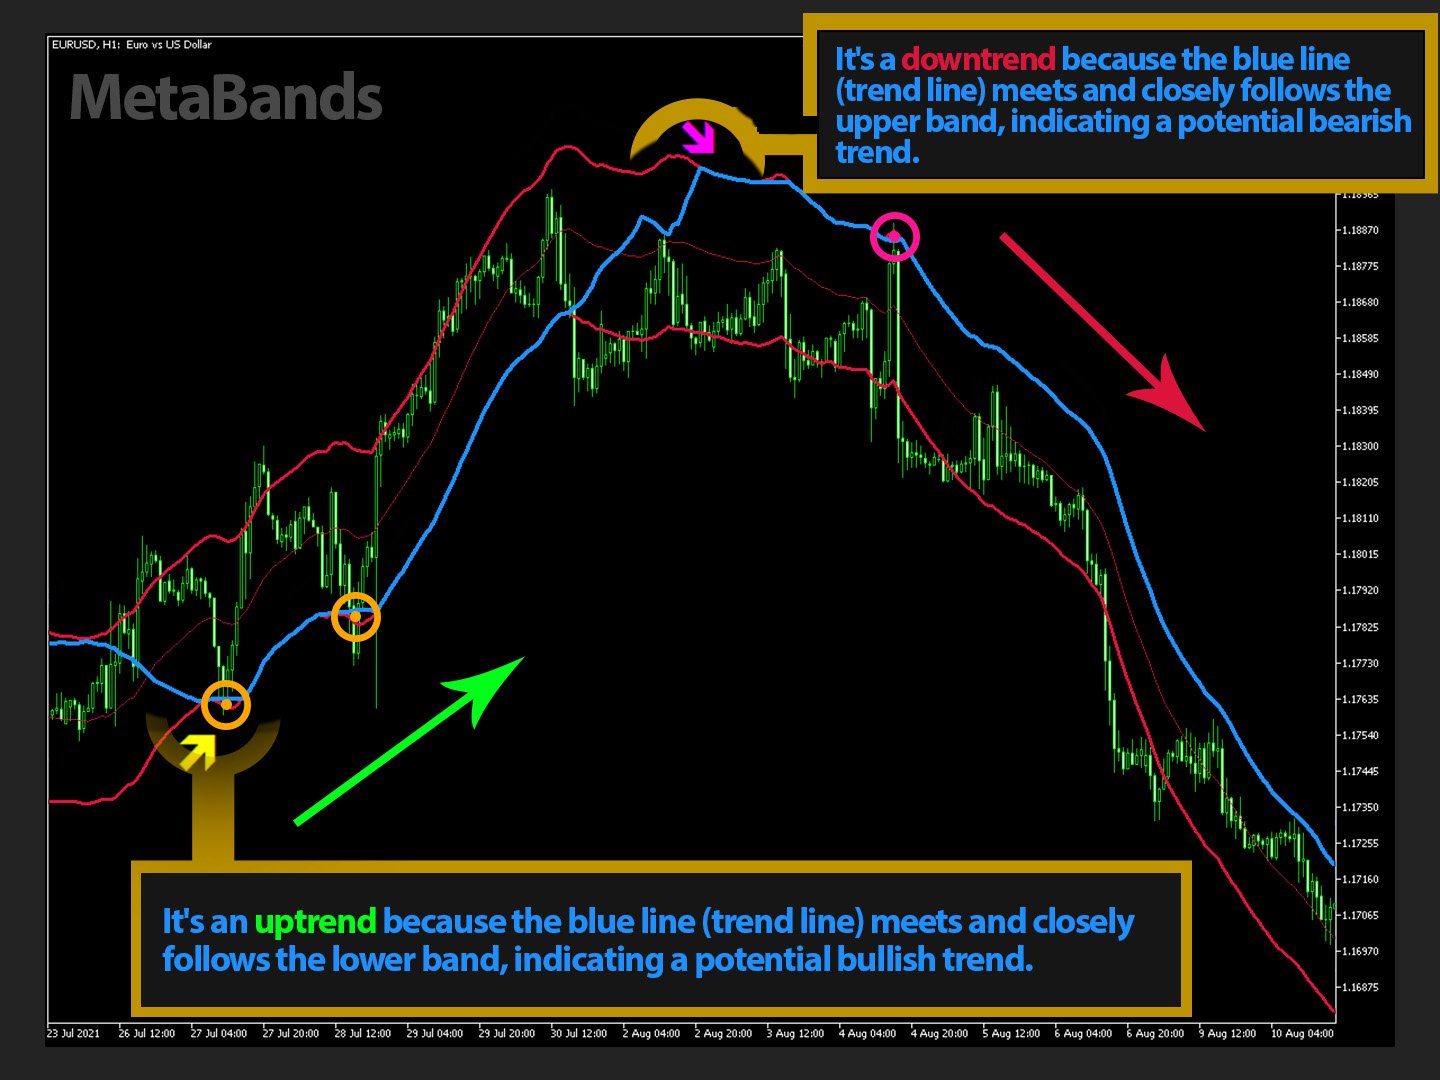
MetaBands使用在通道内振荡的蓝色线来检测趋势。当该线遇到通道的上界时,表明开始下跌趋势,当它遇到下界时,表明开始上涨趋势。如果蓝线接近中线,则市场处于整理期。
该指标使用独特的方法来检测趋势。一开始可能看起来有些复杂,但如果您观看视频教程,您就会意识到它是多么强大且易于使用。
入场和出场信号
当趋势变化或价格穿过上下通道时,MetaBands会立即通过不同的方法提醒交易者,这些方法可以在指标设置中启用。
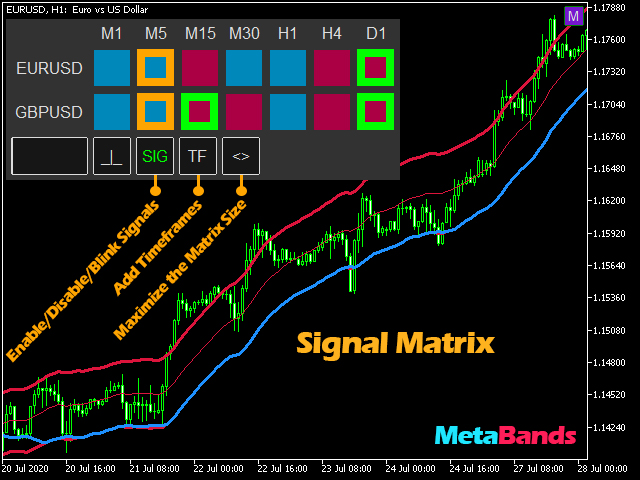
信号矩阵
要监视来自不同时间框架的多个符号并在一个地方查看信号,请单击右上角按钮或按键盘上的M键以打开信号矩阵。该矩阵可以快速概览所选符号和时间框架的情况。使用左下方的框添加更多的符号到矩阵中。输入符号名称并按回车键即可添加。您还可以使用正则表达式。例如,如果您需要添加所有以USD开头的符号,请输入usd*并按回车键。要浏览历史记录,请单击_|_按钮并按住ctrl键,然后移动鼠标以查看不同时间的矩阵。
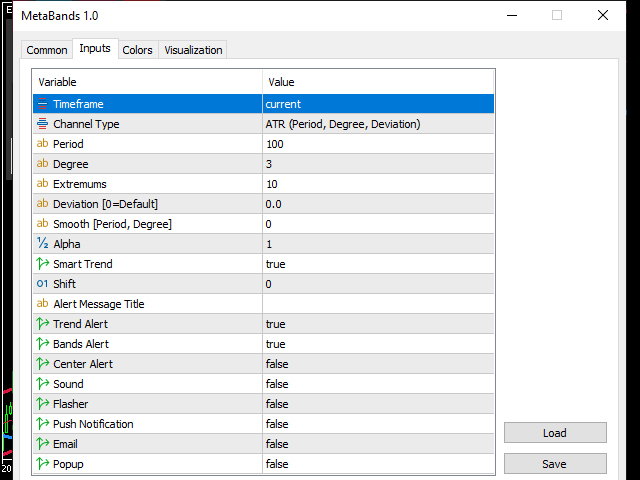
输入参数
通道类型
MetaBands使用不同的算法来绘制其基本通道。平均真实范围(ATR)、标准偏差和回归算法。所选类型所需调整的输入参数也包括在通道类型的名称中。如果您有添加到此列表的想法,请随时与我联系。
周期
最大窗口大小。此输入是一个多输入字段,允许您将多个通道组合成一个单一的通道。例如,如果您选择ATR作为通道类型并输入100、50、100r、80s,则它将组合这四个通道。第一个“100”和“50”通道是ATR类型,第三个通道是100 REG通道,最后一个通道是100 STD通道。因此,您可以通过在每个周期的末尾写入通道类型名称的第一个字母来指定类型。
度数
指定通道使用的移动平均线类型。0 = SMA、1 = EMA、2 = Double EMA、3 = Triple EMA、4 = Quadruple EMA、5 = Quintuple EMA等。
偏差
离中心线的偏差。此输入相当于布林带指标中的偏差输入。
Alpha
定义趋势检测算法的行为。Alpha越大,趋势线移动得越快。为了获得相对较快的趋势线,使用负值的Alpha。负Alpha使算法预测价格的未来,因此速度更快。
智能趋势
智能趋势算法自动调整Alpha以内部取消趋势噪声。Alpha的初始值很重要。
平滑[周期,度数]
这是一个平滑通道的多输入字段。一个单一值将是SMA。您可以写一个逗号并输入另一个值,用于平滑方法的程度。例如,输入100,2告诉指标使用100个双重EMA平滑通道。
每个通道类型名称中列出的所有输入参数都是多输入字段。每个字段允许输入多个逗号分隔的值。例如,如果Period = 100, 50, 25, 12,则可以输入3,2,1作为Degree。正如您所注意到的,度数的数量少于周期(通道)的数量;在这种情况下,MetaBands使用最后一个度数来为其余的通道设置度数。


great program You have to be a genius to write this indicator. like a magic wand .trend direction makes it look amazing